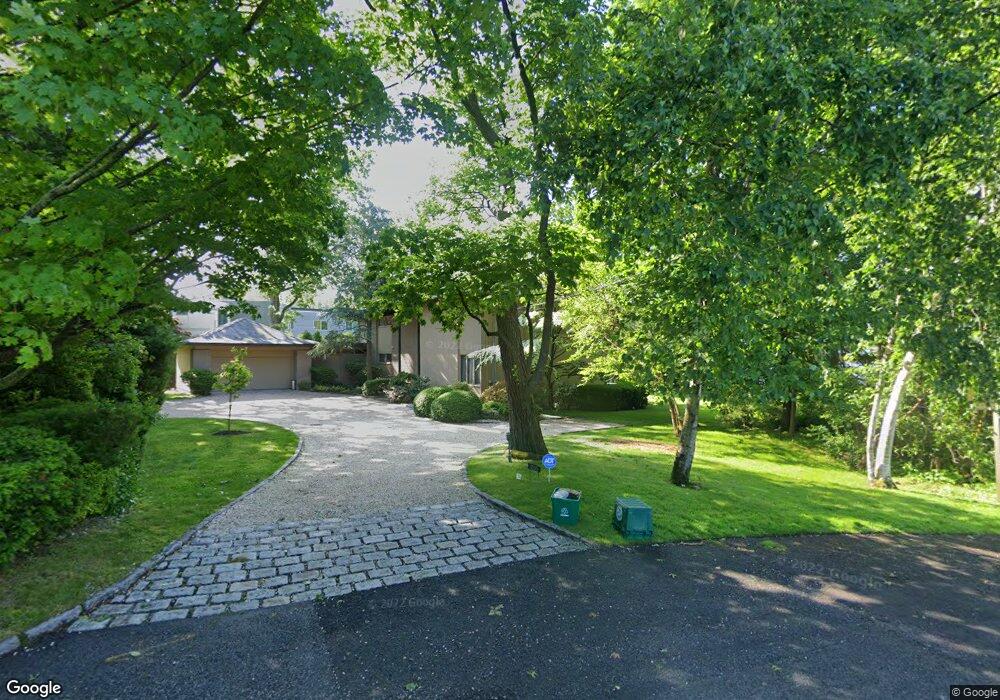
1030 Greacen Point Rd Mamaroneck, NY 10543
Estimated Value: $2,984,000 - $4,553,000
5
Beds
4
Baths
4,080
Sq Ft
$858/Sq Ft
Est. Value
About This Home
This home is located at 1030 Greacen Point Rd, Mamaroneck, NY 10543 and is currently estimated at $3,500,676, approximately $858 per square foot. 1030 Greacen Point Rd is a home located in Westchester County with nearby schools including Mamaroneck High School, Westchester Day School, and French-American School of New York.
Ownership History
Date
Name
Owned For
Owner Type
Purchase Details
Closed on
May 3, 2021
Sold by
Coleman-Fried Jacqueline
Bought by
Coleman Charles T and Coleman Robert
Current Estimated Value
Home Financials for this Owner
Home Financials are based on the most recent Mortgage that was taken out on this home.
Original Mortgage
$920,000
Interest Rate
3.1%
Mortgage Type
Balloon
Purchase Details
Closed on
Jan 15, 2021
Sold by
Coleman Fried Jacqueline and Coleman Charles T
Bought by
Coleman Fried Jacqueline and Coleman Charles T
Purchase Details
Closed on
Aug 22, 2019
Sold by
Coleman M Donald M and Coleman Fried Jacqueline
Bought by
Coleman M Donald M and Coleman Fried Jacqueline
Purchase Details
Closed on
Dec 29, 2005
Sold by
Coleman M Donald
Bought by
Coleman Beverly S and Donald Coleman M
Purchase Details
Closed on
Sep 29, 2005
Sold by
Coleman Beverly S
Bought by
Coleman M Donald and Coleman Beverly S
Create a Home Valuation Report for This Property
The Home Valuation Report is an in-depth analysis detailing your home's value as well as a comparison with similar homes in the area
Home Values in the Area
Average Home Value in this Area
Purchase History
| Date | Buyer | Sale Price | Title Company |
|---|---|---|---|
| Coleman Charles T | $1,150,000 | First American Title | |
| Coleman Fried Jacqueline | -- | None Available | |
| Coleman M Donald M | -- | None Available | |
| Coleman Beverly S | -- | None Available | |
| Coleman M Donald | -- | None Available | |
| Coleman M Donald | -- | None Available |
Source: Public Records
Mortgage History
| Date | Status | Borrower | Loan Amount |
|---|---|---|---|
| Previous Owner | Coleman Charles T | $920,000 |
Source: Public Records
Tax History Compared to Growth
Tax History
| Year | Tax Paid | Tax Assessment Tax Assessment Total Assessment is a certain percentage of the fair market value that is determined by local assessors to be the total taxable value of land and additions on the property. | Land | Improvement |
|---|---|---|---|---|
| 2024 | $67,225 | $3,114,000 | $1,125,000 | $1,989,000 |
| 2023 | $48,586 | $2,910,000 | $1,125,000 | $1,785,000 |
| 2022 | $43,431 | $2,694,000 | $1,125,000 | $1,569,000 |
| 2021 | $59,378 | $2,487,000 | $1,125,000 | $1,362,000 |
| 2020 | $57,617 | $2,346,000 | $1,125,000 | $1,221,000 |
| 2019 | $57,080 | $2,346,000 | $1,125,000 | $1,221,000 |
| 2018 | $56,464 | $2,346,000 | $1,125,000 | $1,221,000 |
| 2017 | $0 | $2,346,000 | $1,125,000 | $1,221,000 |
| 2016 | $41,699 | $2,300,000 | $1,125,000 | $1,175,000 |
| 2015 | -- | $2,530,000 | $1,125,000 | $1,405,000 |
| 2014 | -- | $2,300,000 | $1,125,000 | $1,175,000 |
| 2013 | -- | $2,300,000 | $1,125,000 | $1,175,000 |
Source: Public Records
Map
Nearby Homes
- 1160 Greacen Point Rd
- 1015 Seven Oaks Ln
- 915 Skibo Ln
- 1040 Nautilus Ln
- 1016 Orienta Ave
- 1314 Flagler Dr
- 800 Rushmore Ave
- 490 Bleeker Ave Unit 1-J
- 37 Old Post Ln
- 1450 Flagler Dr
- 1015 Old Post Rd Unit 3L
- 1015 Old Post Rd Unit 3N
- 1015 Old Post Rd Unit MM
- 917 Hall St
- 514 Alda Rd
- 342 Richbell Rd Unit A4
- 340 Richbell Rd Unit B4
- 11 Alden Rd Unit 4D
- 11 Alden Rd Unit 2N
- 11 Alden Rd Unit 4C
- 840 Pirates Cove
- 1014 Greacen Point Rd
- 830 Pirates Cove
- 1010 Greacen Point Rd
- 850 Pirates Cove
- 1019 Greacen Point Rd
- 1120 Greacen Point Rd
- 1011 Greacen Point Rd
- 820 Pirates Cove
- 1000 Greacen Point Rd
- 860 Pirates Cove
- 1140 Greacen Point Rd
- 981 Green Meadow Ln
- 825 Pirates Cove
- 943 Greacen Point Rd
- 810 Pirates Cove
- 870 Pirates Cove
- 940 Greacen Point Rd
- 991 Green Meadow Ln
- 1115 Greacen Point Rd