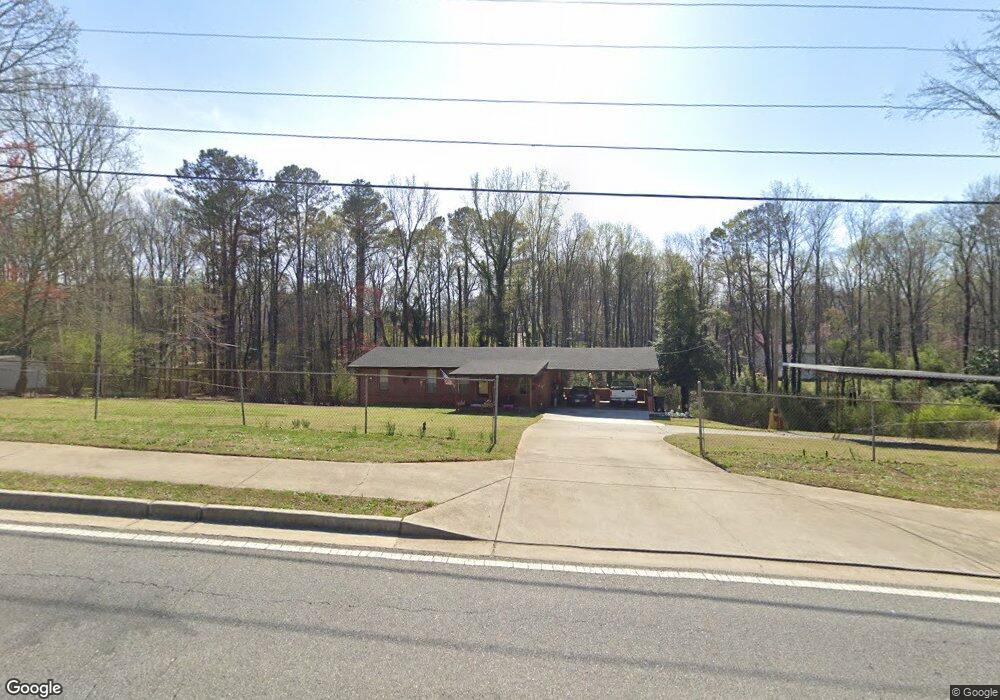
1030 Mullinax Rd Alpharetta, GA 30004
Estimated Value: $410,000 - $592,000
3
Beds
2
Baths
1,275
Sq Ft
$374/Sq Ft
Est. Value
About This Home
This home is located at 1030 Mullinax Rd, Alpharetta, GA 30004 and is currently estimated at $476,503, approximately $373 per square foot. 1030 Mullinax Rd is a home located in Forsyth County with nearby schools including Midway Elementary School, DeSana Middle School, and Denmark High School.
Ownership History
Date
Name
Owned For
Owner Type
Purchase Details
Closed on
Sep 26, 2017
Sold by
Raner Charles R
Bought by
Raner Peggy J and Raner Charles R
Current Estimated Value
Create a Home Valuation Report for This Property
The Home Valuation Report is an in-depth analysis detailing your home's value as well as a comparison with similar homes in the area
Home Values in the Area
Average Home Value in this Area
Purchase History
| Date | Buyer | Sale Price | Title Company |
|---|---|---|---|
| Raner Peggy J | -- | -- |
Source: Public Records
Tax History Compared to Growth
Tax History
| Year | Tax Paid | Tax Assessment Tax Assessment Total Assessment is a certain percentage of the fair market value that is determined by local assessors to be the total taxable value of land and additions on the property. | Land | Improvement |
|---|---|---|---|---|
| 2025 | $420 | $203,224 | $108,800 | $94,424 |
| 2024 | $420 | $173,320 | $96,000 | $77,320 |
| 2023 | $343 | $179,068 | $105,600 | $73,468 |
| 2022 | $440 | $116,604 | $64,000 | $52,604 |
| 2021 | $410 | $116,604 | $64,000 | $52,604 |
| 2020 | $393 | $98,736 | $48,000 | $50,736 |
| 2019 | $396 | $97,948 | $48,000 | $49,948 |
| 2018 | $227 | $55,684 | $20,000 | $35,684 |
| 2017 | $228 | $52,516 | $20,000 | $32,516 |
| 2016 | $223 | $48,516 | $16,000 | $32,516 |
| 2015 | $223 | $48,516 | $16,000 | $32,516 |
| 2014 | $193 | $39,968 | $16,000 | $23,968 |
Source: Public Records
Map
Nearby Homes
- 406 Weatherstone Place
- 5750 Bryson Ln
- 5740 Bryson Ln
- 130 Fowler Hill Rd
- 1465 Queens Ln
- 470 Montgomery Ave
- 419 Grayson Way
- 1615 Waverly Glen Dr
- 368 Grayson Way
- 1620 Woodall View Ct
- 5870 Shiloh Woods Dr
- 1255 Faircrest Crossing Dr
- 5430 Breckinridge Ln
- 6130 Shiloh Woods Dr
- 915 Elmsbrook Ln
- 5512 Atlanta Hwy
- 1570 Winshire Cove
- 5370 Cedar Glenn Ct
- 255 White Pines Dr
- 310 Big Creek Way
- 305 Brandywine Cir
- 1040 Mullinax Rd
- 275 Brandywine Cir
- 710 Streamview Way
- 315 Brandywine Cir
- 265 Brandywine Cir
- 1010 Mullinax Rd
- 1095 Mullinax Rd
- 720 Streamview Way
- 290 Brandywine Cir
- 725 Streamview Way
- 270 Brandywine Cir
- 325 Brandywine Cir
- 310 Brandywine Cir
- 730 Streamview Way
- 735 Streamview Way
- 240 Brandywine Cir
- 740 Ferndale Ct
- 1100 Mullinax Rd
- 730 Ferndale Ct