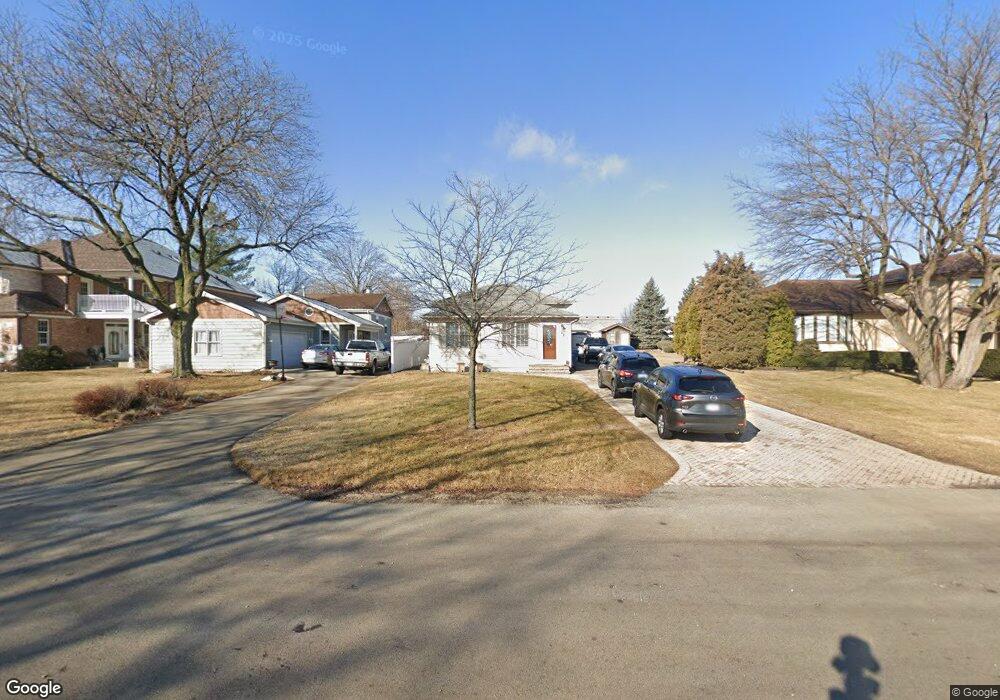
1030 N Princeton Ave Villa Park, IL 60181
Estimated Value: $395,578 - $460,000
--
Bed
--
Bath
1,769
Sq Ft
$243/Sq Ft
Est. Value
About This Home
This home is located at 1030 N Princeton Ave, Villa Park, IL 60181 and is currently estimated at $430,395, approximately $243 per square foot. 1030 N Princeton Ave is a home located in DuPage County with nearby schools including Ardmore Elementary School, Indian Trail Jr High School, and Addison Trail High School.
Ownership History
Date
Name
Owned For
Owner Type
Purchase Details
Closed on
Jan 22, 2001
Sold by
Lodzinski Cezary and Lodzinski Katarzyna
Bought by
Kulikowski Arkadiusz
Current Estimated Value
Home Financials for this Owner
Home Financials are based on the most recent Mortgage that was taken out on this home.
Original Mortgage
$186,400
Interest Rate
7.75%
Purchase Details
Closed on
Dec 19, 1997
Sold by
First Suburban National Bank
Bought by
Lodzinski Cezary and Lodzinski Katarzyna
Home Financials for this Owner
Home Financials are based on the most recent Mortgage that was taken out on this home.
Original Mortgage
$148,500
Interest Rate
7.35%
Purchase Details
Closed on
Oct 14, 1997
Sold by
Votava James Michael
Bought by
First Suburban National Bank and Trust #96-6103
Create a Home Valuation Report for This Property
The Home Valuation Report is an in-depth analysis detailing your home's value as well as a comparison with similar homes in the area
Home Values in the Area
Average Home Value in this Area
Purchase History
| Date | Buyer | Sale Price | Title Company |
|---|---|---|---|
| Kulikowski Arkadiusz | $233,000 | Stewart Title Company | |
| Lodzinski Cezary | $165,000 | -- | |
| First Suburban National Bank | $42,000 | Attorneys Title Guaranty Fun |
Source: Public Records
Mortgage History
| Date | Status | Borrower | Loan Amount |
|---|---|---|---|
| Previous Owner | Kulikowski Arkadiusz | $186,400 | |
| Previous Owner | Lodzinski Cezary | $148,500 |
Source: Public Records
Tax History Compared to Growth
Tax History
| Year | Tax Paid | Tax Assessment Tax Assessment Total Assessment is a certain percentage of the fair market value that is determined by local assessors to be the total taxable value of land and additions on the property. | Land | Improvement |
|---|---|---|---|---|
| 2024 | $5,952 | $102,329 | $36,093 | $66,236 |
| 2023 | $5,667 | $94,070 | $33,180 | $60,890 |
| 2022 | $5,374 | $87,470 | $30,660 | $56,810 |
| 2021 | $5,078 | $83,790 | $29,370 | $54,420 |
| 2020 | $4,887 | $80,260 | $28,130 | $52,130 |
| 2019 | $4,847 | $77,170 | $27,050 | $50,120 |
| 2018 | $4,587 | $69,740 | $27,050 | $42,690 |
| 2017 | $4,478 | $66,650 | $25,850 | $40,800 |
| 2016 | $4,261 | $61,540 | $23,870 | $37,670 |
| 2015 | $4,174 | $56,850 | $22,050 | $34,800 |
| 2014 | $4,637 | $62,200 | $25,990 | $36,210 |
| 2013 | $4,417 | $63,470 | $26,520 | $36,950 |
Source: Public Records
Map
Nearby Homes
- 921 S Iowa Ave
- 913 S Iowa Ave
- 2N152 Wisconsin Ave
- 625 S Yale Ave
- 600 E Armitage Ave
- 437 E Lorraine Ave
- 461 S Ardmore Terrace
- 445 S Yale Ave
- 204 E Hill St
- 739 N 2nd Ave
- 17W517 Manor Ln
- 901 E Krage Dr
- 490 N Chatham Ave
- 902 E Krage Dr
- 901 E Babcock Ave
- 117 E Vermont St
- 311 N Shady Ln
- 112 S Iowa Ave
- 426 S Adeline Ave
- 354 N 3rd Ave
- 1026 N Princeton Ave
- 1022 N Princeton Ave
- 1036 N Princeton Ave
- 1040 N Princeton Ave
- 1016 N Princeton Ave
- 1044 N Princeton Ave
- 1031 N Yale Ave
- 1035 N Yale Ave
- 1039 N Yale Ave
- 1023 N Yale Ave
- 1019 N Yale Ave
- 45 Belden Ave
- 1043 N Yale Ave
- 1015 N Yale Ave
- 1047 N Yale Ave
- 35 Belden Ave
- 1005 N Yale Ave
- 1104 N Princeton Ave
- 1001 N Yale Ave
- 1108 N Princeton Ave