1030 Old Harshman Rd Dayton, OH 45431
Estimated Value: $112,000 - $139,000
3
Beds
2
Baths
1,248
Sq Ft
$102/Sq Ft
Est. Value
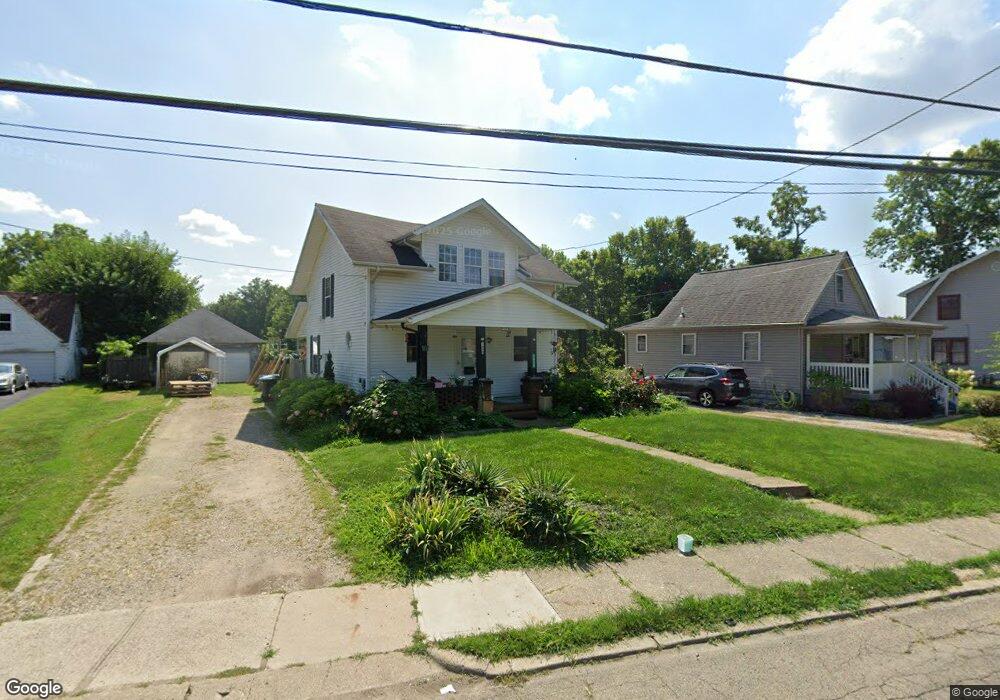
About This Home
This home is located at 1030 Old Harshman Rd, Dayton, OH 45431 and is currently estimated at $126,891, approximately $101 per square foot. 1030 Old Harshman Rd is a home located in Montgomery County with nearby schools including Stebbins High School, Horizon Science Academy Dayton Downtown, and St. Helen Elementary School.
Ownership History
Date
Name
Owned For
Owner Type
Purchase Details
Closed on
Jun 30, 2004
Sold by
Hatten Jack D and Hatten Debra D
Bought by
Lee Freddy and Middleton Michaela Else
Current Estimated Value
Home Financials for this Owner
Home Financials are based on the most recent Mortgage that was taken out on this home.
Original Mortgage
$99,900
Outstanding Balance
$17,613
Interest Rate
5.5%
Mortgage Type
Seller Take Back
Estimated Equity
$109,278
Purchase Details
Closed on
Feb 14, 2003
Sold by
American General Finance Inc
Bought by
Hatten Jack and Hatten Family Trust
Purchase Details
Closed on
Oct 17, 2002
Sold by
Hammett Timothy F
Bought by
American General Financial Services Inc
Purchase Details
Closed on
Sep 23, 2002
Sold by
Hammett Timothy F and Hammett Lynda J
Bought by
American General Finance Inc
Create a Home Valuation Report for This Property
The Home Valuation Report is an in-depth analysis detailing your home's value as well as a comparison with similar homes in the area
Home Values in the Area
Average Home Value in this Area
Purchase History
| Date | Buyer | Sale Price | Title Company |
|---|---|---|---|
| Lee Freddy | $99,900 | First American | |
| Hatten Jack | $51,000 | -- | |
| American General Financial Services Inc | $45,000 | -- | |
| Bank One Na | $4,658 | Lawyers Title Ins Corp | |
| American General Finance Inc | $45,000 | -- |
Source: Public Records
Mortgage History
| Date | Status | Borrower | Loan Amount |
|---|---|---|---|
| Open | Lee Freddy | $99,900 |
Source: Public Records
Tax History Compared to Growth
Tax History
| Year | Tax Paid | Tax Assessment Tax Assessment Total Assessment is a certain percentage of the fair market value that is determined by local assessors to be the total taxable value of land and additions on the property. | Land | Improvement |
|---|---|---|---|---|
| 2024 | $900 | $18,170 | $6,480 | $11,690 |
| 2023 | $900 | $18,170 | $6,480 | $11,690 |
| 2022 | $1,195 | $18,170 | $6,480 | $11,690 |
| 2021 | $1,217 | $18,170 | $6,480 | $11,690 |
| 2020 | $1,217 | $18,170 | $6,480 | $11,690 |
| 2019 | $1,297 | $17,300 | $5,400 | $11,900 |
| 2018 | $1,300 | $17,300 | $5,400 | $11,900 |
| 2017 | $1,301 | $17,300 | $5,400 | $11,900 |
| 2016 | $1,354 | $17,490 | $5,400 | $12,090 |
| 2015 | $1,489 | $17,490 | $5,400 | $12,090 |
| 2014 | $1,489 | $17,490 | $5,400 | $12,090 |
| 2012 | -- | $19,030 | $5,560 | $13,470 |
Source: Public Records
Map
Nearby Homes
- 5051 Norman Blvd
- 4840 Springfield St
- 4533 Fair Park Ave
- 423 Briarwood Ave
- 1718 Radio Rd
- 334 Blackwood Ave
- 400 N Cherrywood Ave
- 1708 Rangeley Ave
- 251 N Smithville Rd
- 241 N Smithville Rd
- 321 N Cherrywood Ave
- 446 N Garland Ave
- 1333 Radio Rd
- 166 Ellington Rd
- 2301 Valley Pike
- 2249 - Valley Pike
- -- Valley Pike
- - Valley Pike
- 4533 Maughn Dr
- 3322 Vagabond Ln
- 1026 Old Harshman Rd
- 1048 Old Harshman Rd
- 1049 Old Harshman Rd
- 1027 Old Harshman Rd
- 1052 Old Harshman Rd
- 1018 Old Harshman Rd
- 1047 Old Harshman Rd
- 5118 Bower Ave
- 5117 Northcliff Dr
- 1011 Old Harshman Rd
- 1051 Old Harshman Rd
- 5122 Bower Ave
- 5121 Northcliff Dr
- 1000 Old Harshman Rd
- 1100 Old Harshman Rd
- 5126 Bower Ave
- 1109 Old Harshman Rd
- 5125 Northcliff Dr
- 5134 Bower Ave
- 5131 Bower Ave