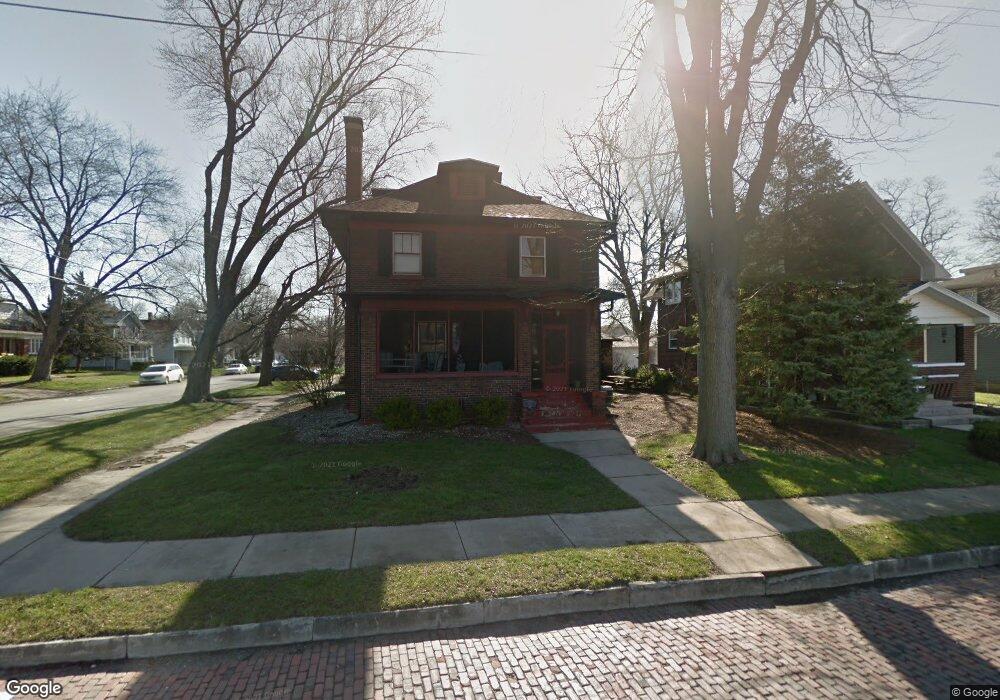
1030 Post St Ottawa, IL 61350
Estimated Value: $154,033 - $190,000
4
Beds
2
Baths
1,800
Sq Ft
$95/Sq Ft
Est. Value
About This Home
This home is located at 1030 Post St, Ottawa, IL 61350 and is currently estimated at $170,758, approximately $94 per square foot. 1030 Post St is a home located in LaSalle County with nearby schools including Ottawa Township High School, Marquette Academy, and Marquette Elementary School.
Ownership History
Date
Name
Owned For
Owner Type
Purchase Details
Closed on
Jun 26, 2024
Sold by
Wackerlin Russell R and Wackerlin Beth A
Bought by
Wackerlin Russell R and Beth A Wackerlin Trust
Current Estimated Value
Purchase Details
Closed on
Jul 13, 2018
Sold by
Wackerlin Russell R and Wackerlin Est Wayne R
Bought by
Wackerlin Russell R and Wackerlin Beth A
Purchase Details
Closed on
Feb 25, 2011
Sold by
Jackson Robert C
Bought by
Wackerlin Wayne R
Home Financials for this Owner
Home Financials are based on the most recent Mortgage that was taken out on this home.
Original Mortgage
$76,000
Interest Rate
4.76%
Mortgage Type
Purchase Money Mortgage
Purchase Details
Closed on
Nov 8, 2005
Sold by
Jackson Robert C and Jackson Robert
Bought by
Jackson Robert C
Purchase Details
Closed on
Sep 2, 2005
Sold by
Contract Funding Llc
Bought by
Jackson Robert
Create a Home Valuation Report for This Property
The Home Valuation Report is an in-depth analysis detailing your home's value as well as a comparison with similar homes in the area
Home Values in the Area
Average Home Value in this Area
Purchase History
| Date | Buyer | Sale Price | Title Company |
|---|---|---|---|
| Wackerlin Russell R | -- | None Available | |
| Wackerlin Russell R | $90,000 | None Available | |
| Wackerlin Wayne R | $90,000 | None Available | |
| Jackson Robert C | -- | None Available | |
| Jackson Robert | $115,900 | None Available |
Source: Public Records
Mortgage History
| Date | Status | Borrower | Loan Amount |
|---|---|---|---|
| Previous Owner | Wackerlin Wayne R | $76,000 |
Source: Public Records
Tax History
| Year | Tax Paid | Tax Assessment Tax Assessment Total Assessment is a certain percentage of the fair market value that is determined by local assessors to be the total taxable value of land and additions on the property. | Land | Improvement |
|---|---|---|---|---|
| 2024 | $4,284 | $41,594 | $3,611 | $37,983 |
| 2023 | $3,921 | $37,227 | $3,232 | $33,995 |
| 2022 | $3,607 | $33,787 | $7,949 | $25,838 |
| 2021 | $3,405 | $31,669 | $7,451 | $24,218 |
| 2020 | $3,218 | $30,084 | $7,078 | $23,006 |
| 2019 | $3,294 | $29,777 | $7,006 | $22,771 |
| 2018 | $2,549 | $29,062 | $6,838 | $22,224 |
| 2017 | $2,441 | $28,172 | $6,629 | $21,543 |
| 2016 | $2,317 | $26,964 | $6,345 | $20,619 |
| 2015 | $2,172 | $25,722 | $6,053 | $19,669 |
| 2012 | -- | $28,119 | $6,617 | $21,502 |
Source: Public Records
Map
Nearby Homes
- 1009 Paul St
- 537 Saint George St
- 522 E Superior St
- 820 Columbus St
- 314 Congress St
- 713 E Superior St
- 540 Pearl St
- 621 Chapel St
- 806 Fulton St
- 607 E Joliet St
- 565 E Norris Dr
- 913 Canal St
- 702 E Joliet St
- 706 E Joliet St
- 213 Deleon St
- 1116 Chestnut St
- 1845 La Salle St
- 608 W Madison St
- 718 W Jackson St
- 1404 Walter Way
- 1020 Post St
- 309 E Washington St
- 313 E Washington St
- 1102 Post St
- 319 E Washington St
- 1010 Post St
- 314 E Washington St
- 1106 Post St
- 318 E Washington St
- 1103 Post St
- 1103 Post St Unit 2N
- 1103 Post St Unit 2S
- 1103 Post St Unit 1
- 1110 Post St
- 300 E Lafayette St
- 316 E Lafayette St
- 312 E Lafayette St
- 312 E Lafayette St Unit B
- 324 E Washington St
- 327 E Washington St
Your Personal Tour Guide
Ask me questions while you tour the home.