B
Seller's Agent in 2024
Barbara Lima
Laer Realty
2 in this area
9 Total Sales

Estimated Value: $788,094 - $838,000
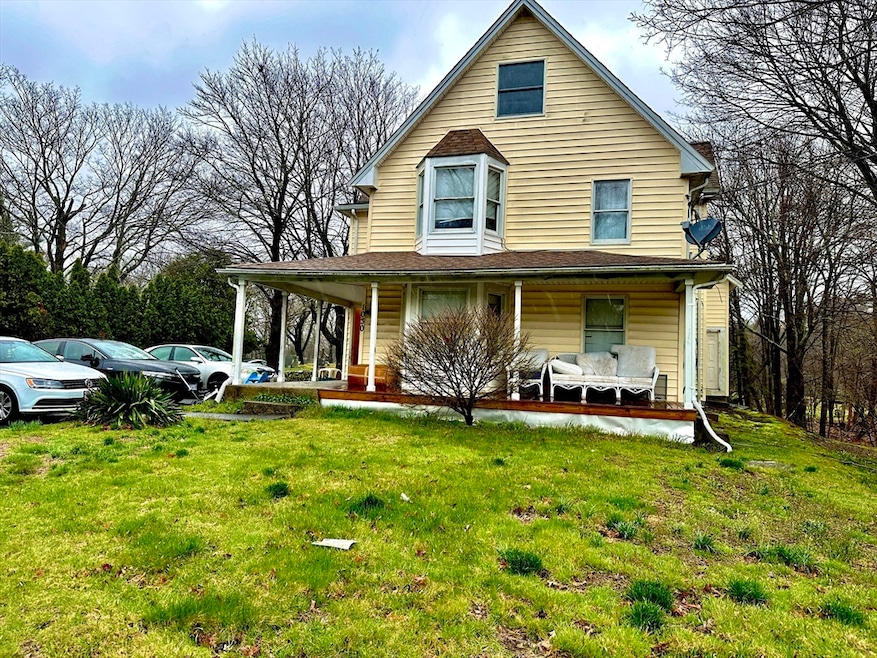
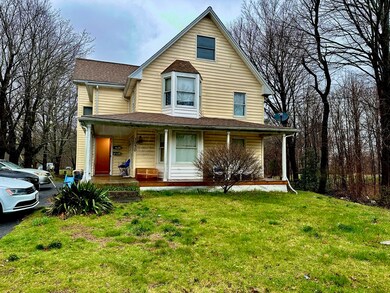
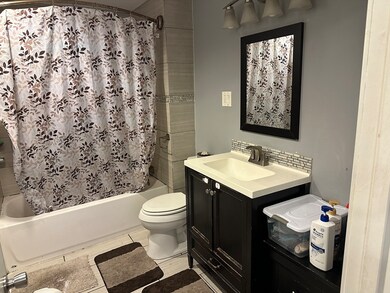
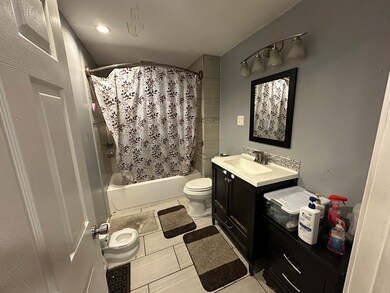
Welcome to your new investment opportunity! This two family home is located close to the center of Holbrook, a great location. This property also presents an excellent opportunity for the owner occupant, providing the potential for a steady stream of supplement income. The first floor unit consists of 3 bedrooms, 1 bath. The second floor features 3 bedrooms, and 1 full bath. Laundry is in the basement and both units have access. Ample storage room in unfinished basement as well. Large backyard. New driveway was done recently. Both units are tenants at will. Don’t miss out on this great opportunity!! Buyer and Buyer Agent to perform all due diligence.
Last Buyer's Agent
Marcus Duviella
Divine Real Estate, Inc.
| Date | Buyer | Sale Price | Title Company |
|---|---|---|---|
| Lamour Pedro | $755,000 | None Available | |
| Anderson Emma C | $460,000 | None Available | |
| Vava Vani Llc | $660,000 | None Available | |
| Toussaint Nadine D | $220,000 | -- |
| Date | Status | Borrower | Loan Amount |
|---|---|---|---|
| Open | Lamour Pedro | $738,908 | |
| Closed | Lamour Pedro | $738,908 | |
| Previous Owner | Vava Vani Llc | $490,500 | |
| Previous Owner | Toussaint Nadine D | $216,015 |
| Date | Event | Price | List to Sale | Price per Sq Ft | Prior Sale |
|---|---|---|---|---|---|
| 08/21/2024 08/21/24 | Sold | $755,000 | +0.7% | $282 / Sq Ft | |
| 06/21/2024 06/21/24 | Pending | -- | -- | -- | |
| 04/16/2024 04/16/24 | For Sale | $749,900 | +13.6% | $280 / Sq Ft | |
| 04/15/2022 04/15/22 | Sold | $660,000 | +1.7% | $246 / Sq Ft | View Prior Sale |
| 03/03/2022 03/03/22 | Pending | -- | -- | -- | |
| 03/01/2022 03/01/22 | For Sale | -- | -- | -- | |
| 01/23/2022 01/23/22 | Pending | -- | -- | -- | |
| 01/20/2022 01/20/22 | For Sale | $649,000 | +195.0% | $242 / Sq Ft | |
| 11/16/2015 11/16/15 | Sold | $220,000 | -4.3% | $82 / Sq Ft | View Prior Sale |
| 10/05/2015 10/05/15 | Pending | -- | -- | -- | |
| 09/14/2015 09/14/15 | For Sale | $229,900 | -- | $86 / Sq Ft |
| Year | Tax Paid | Tax Assessment Tax Assessment Total Assessment is a certain percentage of the fair market value that is determined by local assessors to be the total taxable value of land and additions on the property. | Land | Improvement |
|---|---|---|---|---|
| 2025 | $85 | $642,500 | $235,200 | $407,300 |
| 2024 | $8,256 | $614,300 | $226,500 | $387,800 |
| 2023 | $8,728 | $567,500 | $202,300 | $365,200 |
| 2022 | $7,348 | $445,600 | $180,100 | $265,500 |
| 2021 | $7,100 | $412,300 | $168,400 | $243,900 |
| 2020 | $7,043 | $383,400 | $157,500 | $225,900 |
| 2019 | $7,015 | $360,500 | $157,400 | $203,100 |
| 2018 | $6,397 | $309,500 | $135,900 | $173,600 |
| 2017 | $6,013 | $287,700 | $123,900 | $163,800 |
| 2016 | $5,588 | $284,500 | $113,100 | $171,400 |
| 2015 | $5,409 | $283,500 | $115,500 | $168,000 |
| 2014 | $5,081 | $270,700 | $97,500 | $173,200 |
B
Seller's Agent in 2024
Barbara Lima
Laer Realty
2 in this area
9 Total Sales

Seller Co-Listing Agent in 2024
Manuel Neto
Laer Realty
(617) 719-6474
2 in this area
138 Total Sales
M
Buyer's Agent in 2024
Marcus Duviella
Divine Real Estate, Inc.
E
Seller's Agent in 2022
Eli Abreu
Expert Brokers
(617) 799-2057
1 in this area
18 Total Sales
P
Seller's Agent in 2015
Paul Gordon
Gordon Crowley Real Estate
(617) 650-4606
7 in this area
15 Total Sales
Buyer's Agent in 2015
Donna Chase
William Raveis R.E. & Home Services
(617) 803-2660
68 Total Sales
Source: MLS Property Information Network (MLS PIN)
MLS Number: 73224441
APN: HOLB-000055-000000-000019
Disclaimer: Certain information contained herein is derived from information provided by parties other than Homes.com. All information provided is deemed reliable, but is not guaranteed to be accurate and should be independently verified.
![]() The property listing data and information, or the Images, set forth herein were provided to MLS Property Information Network, Inc. from third party sources, including sellers, lessors and public records, and were compiled by MLS Property Information Network, Inc. The property listing data and information, and the Images, are for the personal, non-commercial use of consumers having a good faith interest in purchasing or leasing listed properties of the type displayed to them and may not be used for any purpose other than to identify prospective properties which such consumers may have a good faith interest in purchasing or leasing. MLS Property Information Network, Inc. and its subscribers disclaim any and all representations and warranties as to the accuracy of the property listing data and information, or as to the accuracy of any of the Images, set forth herein.
The property listing data and information, or the Images, set forth herein were provided to MLS Property Information Network, Inc. from third party sources, including sellers, lessors and public records, and were compiled by MLS Property Information Network, Inc. The property listing data and information, and the Images, are for the personal, non-commercial use of consumers having a good faith interest in purchasing or leasing listed properties of the type displayed to them and may not be used for any purpose other than to identify prospective properties which such consumers may have a good faith interest in purchasing or leasing. MLS Property Information Network, Inc. and its subscribers disclaim any and all representations and warranties as to the accuracy of the property listing data and information, or as to the accuracy of any of the Images, set forth herein.