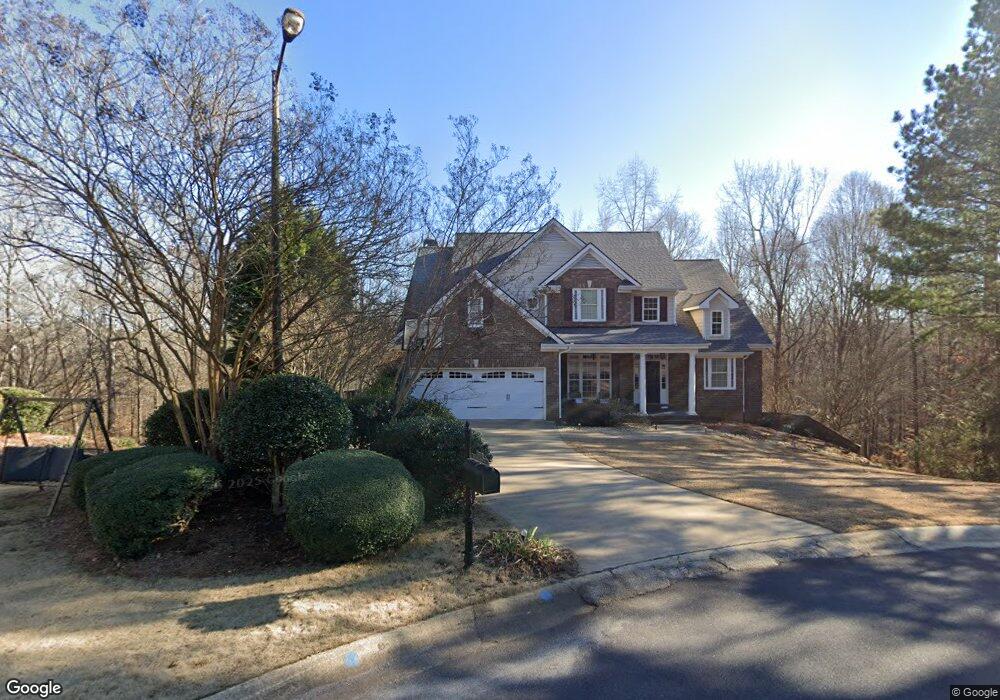
1030 Sylvia Ct Athens, GA 30606
Estimated Value: $690,652 - $835,000
4
Beds
4
Baths
2,811
Sq Ft
$266/Sq Ft
Est. Value
About This Home
This home is located at 1030 Sylvia Ct, Athens, GA 30606 and is currently estimated at $747,913, approximately $266 per square foot. 1030 Sylvia Ct is a home located in Oconee County with nearby schools including Oconee County Elementary School, Oconee County Primary School, and Oconee County Middle School.
Ownership History
Date
Name
Owned For
Owner Type
Purchase Details
Closed on
Apr 27, 2016
Sold by
Scarborough Christopher P
Bought by
Caspary Scott and Caspary Alye
Current Estimated Value
Home Financials for this Owner
Home Financials are based on the most recent Mortgage that was taken out on this home.
Original Mortgage
$360,000
Outstanding Balance
$287,051
Interest Rate
3.71%
Mortgage Type
New Conventional
Estimated Equity
$460,862
Purchase Details
Closed on
Jun 8, 2005
Sold by
Brian Baker Building Inc
Bought by
Scarborough Christopher P and Scarborough Molli B
Home Financials for this Owner
Home Financials are based on the most recent Mortgage that was taken out on this home.
Original Mortgage
$210,000
Interest Rate
5.7%
Mortgage Type
New Conventional
Purchase Details
Closed on
Mar 3, 1997
Sold by
Sts Developers Inc
Bought by
Dillard Susan Kay
Create a Home Valuation Report for This Property
The Home Valuation Report is an in-depth analysis detailing your home's value as well as a comparison with similar homes in the area
Home Values in the Area
Average Home Value in this Area
Purchase History
| Date | Buyer | Sale Price | Title Company |
|---|---|---|---|
| Caspary Scott | $400,000 | -- | |
| Scarborough Christopher P | $389,900 | -- | |
| Dillard Susan Kay | $45,500 | -- |
Source: Public Records
Mortgage History
| Date | Status | Borrower | Loan Amount |
|---|---|---|---|
| Open | Caspary Scott | $360,000 | |
| Previous Owner | Scarborough Christopher P | $210,000 |
Source: Public Records
Tax History Compared to Growth
Tax History
| Year | Tax Paid | Tax Assessment Tax Assessment Total Assessment is a certain percentage of the fair market value that is determined by local assessors to be the total taxable value of land and additions on the property. | Land | Improvement |
|---|---|---|---|---|
| 2024 | $4,468 | $235,844 | $36,300 | $199,544 |
| 2023 | $4,443 | $221,984 | $31,460 | $190,524 |
| 2022 | $4,354 | $201,255 | $31,460 | $169,795 |
| 2021 | $4,142 | $177,360 | $29,040 | $148,320 |
| 2020 | $4,146 | $177,279 | $29,040 | $148,239 |
| 2019 | $3,884 | $165,942 | $29,040 | $136,902 |
| 2018 | $3,895 | $162,930 | $29,040 | $133,890 |
| 2017 | $3,745 | $156,596 | $29,040 | $127,556 |
| 2016 | $3,613 | $153,016 | $29,040 | $123,976 |
| 2015 | $3,596 | $151,962 | $29,040 | $122,922 |
| 2014 | $3,573 | $147,656 | $29,040 | $118,616 |
| 2013 | -- | $142,894 | $29,040 | $113,854 |
Source: Public Records
Map
Nearby Homes
- 1050 Chestnut Glen
- 1010 Springview Ct
- 1621 Daniells Bridge Rd
- 1011 Magnolia Dr
- 1340 Old Epps Bridge Rd
- 1231 Founders Lake Dr
- 2481 Lakewood Manor Dr
- 1271 Daniells Bridge Rd
- 1080 Barber Creek Dr
- 1091 Barber Creek Dr
- 1051 Riverhaven Ln
- 3065 Meadow Springs Dr
- 1020 Barber Creek Dr Unit 211
- 165 Canterbury Dr
- 1220 Twelve Oaks Cir
- 1191 Arrowhead Rd
- 160 Edgewood Dr
- 8420 Macon Hwy