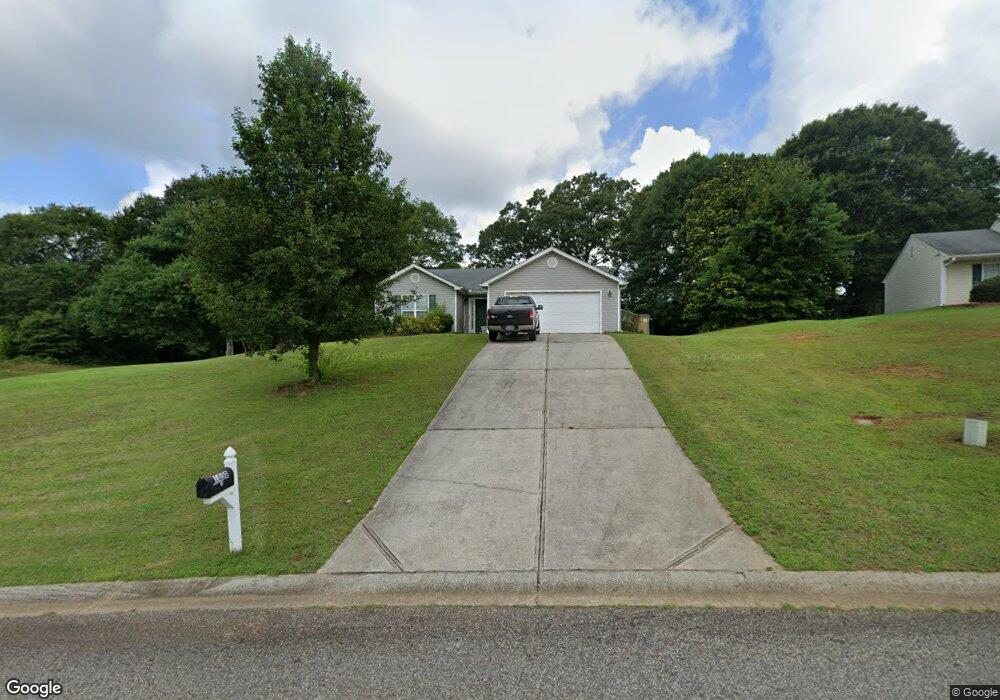
1030 Tia Dr Bethlehem, GA 30620
Estimated Value: $285,000 - $304,000
3
Beds
2
Baths
1,430
Sq Ft
$207/Sq Ft
Est. Value
About This Home
This home is located at 1030 Tia Dr, Bethlehem, GA 30620 and is currently estimated at $296,407, approximately $207 per square foot. 1030 Tia Dr is a home located in Barrow County with nearby schools including Bethlehem Elementary School, Haymon-Morris Middle School, and Apalachee High School.
Ownership History
Date
Name
Owned For
Owner Type
Purchase Details
Closed on
Feb 18, 2011
Sold by
Federal Home Loan Mortgage Corporation
Bought by
Pendley Brian D
Current Estimated Value
Home Financials for this Owner
Home Financials are based on the most recent Mortgage that was taken out on this home.
Original Mortgage
$81,865
Outstanding Balance
$55,212
Interest Rate
4.71%
Mortgage Type
New Conventional
Estimated Equity
$241,195
Purchase Details
Closed on
Nov 2, 2010
Sold by
Ocwen Ln Servicing Llc
Bought by
Federal Home Loan Mortgage Corporation
Purchase Details
Closed on
Dec 1, 2009
Sold by
Suntrust Mtg Inc
Bought by
Hud-Housing Of Urban Dev
Purchase Details
Closed on
Jun 29, 2007
Sold by
Southfork Hms Inc
Bought by
Juarez Maria
Home Financials for this Owner
Home Financials are based on the most recent Mortgage that was taken out on this home.
Original Mortgage
$117,700
Interest Rate
6.35%
Mortgage Type
New Conventional
Purchase Details
Closed on
Apr 13, 2007
Sold by
Tia Estate Developers Llc
Bought by
Southfork Homes Inc
Purchase Details
Closed on
Jan 27, 2006
Sold by
Sjc Developers Llc
Bought by
Tia Estate Developers Llc
Create a Home Valuation Report for This Property
The Home Valuation Report is an in-depth analysis detailing your home's value as well as a comparison with similar homes in the area
Home Values in the Area
Average Home Value in this Area
Purchase History
| Date | Buyer | Sale Price | Title Company |
|---|---|---|---|
| Pendley Brian D | -- | -- | |
| Federal Home Loan Mortgage Corporation | -- | -- | |
| Ocwen Ln Servicing Llc | $64,500 | -- | |
| Hud-Housing Of Urban Dev | -- | -- | |
| Juarez Maria | $123,900 | -- | |
| Southfork Homes Inc | $39,000 | -- | |
| Tia Estate Developers Llc | $474,000 | -- |
Source: Public Records
Mortgage History
| Date | Status | Borrower | Loan Amount |
|---|---|---|---|
| Open | Pendley Brian D | $81,865 | |
| Previous Owner | Juarez Maria | $117,700 |
Source: Public Records
Tax History
| Year | Tax Paid | Tax Assessment Tax Assessment Total Assessment is a certain percentage of the fair market value that is determined by local assessors to be the total taxable value of land and additions on the property. | Land | Improvement |
|---|---|---|---|---|
| 2025 | $2,252 | $96,718 | $20,000 | $76,718 |
| 2024 | $2,335 | $94,477 | $20,000 | $74,477 |
| 2023 | $1,925 | $94,877 | $20,000 | $74,877 |
| 2022 | $1,835 | $64,394 | $12,320 | $52,074 |
| 2021 | $1,920 | $64,394 | $12,320 | $52,074 |
| 2020 | $2,035 | $64,394 | $12,320 | $52,074 |
| 2019 | $1,812 | $55,892 | $11,200 | $44,692 |
| 2018 | $1,791 | $55,892 | $11,200 | $44,692 |
| 2017 | $1,286 | $44,182 | $10,000 | $34,182 |
| 2016 | $1,256 | $38,858 | $10,000 | $28,858 |
| 2015 | $1,271 | $39,164 | $10,000 | $29,164 |
| 2014 | $1,254 | $37,310 | $7,840 | $29,470 |
| 2013 | -- | $35,559 | $7,840 | $27,719 |
Source: Public Records
Map
Nearby Homes
- 1050 Bethlehem Church Rd
- 534 Walton Dr
- 812 Christmas Ave
- 784 Manger Ave
- 0 Manger Ave E Unit 20154677
- 0 Manger Ave E Unit 20127001
- 82 McElhannon Rd SE
- 53 Rowlett Place
- 54 Rowlett Place
- 73 Rowlett Place
- 724 Manger Ave
- 465 Cade Ct
- 1224 Dale Dr
- 1408 Wyndham Way
- 129 Carnaby St
- 463 Gin Mill Dr
- 898 Harrison Mill Rd
- 449 & 455 Carl-Bethlehem Rd
- 884 Jackson Trail Rd
- 1101 Kailie Dr
- 1032 Tia Dr
- 1032 Tia Dr Unit 1032
- 1036 Tia Dr
- 201 Tia Ct Unit 18
- 201 Tia Ct
- 1038 Tia Dr
- 213 Manning Gin Rd
- 1124 Yearwood Rd
- 203 Tia Ct
- 0 Yearwood Rd Unit 973194
- 0 Yearwood Rd Unit 8723433
- 1039 Tia Dr
- 1135 Yearwood Rd
- 1042 Tia Dr
- 205 Tia Ct
- 1043 Tia Dr
- 204 Tia Ct
- 164 Manning Gin Rd
- 221 Manning Gin Rd
- 1044 Tia Dr