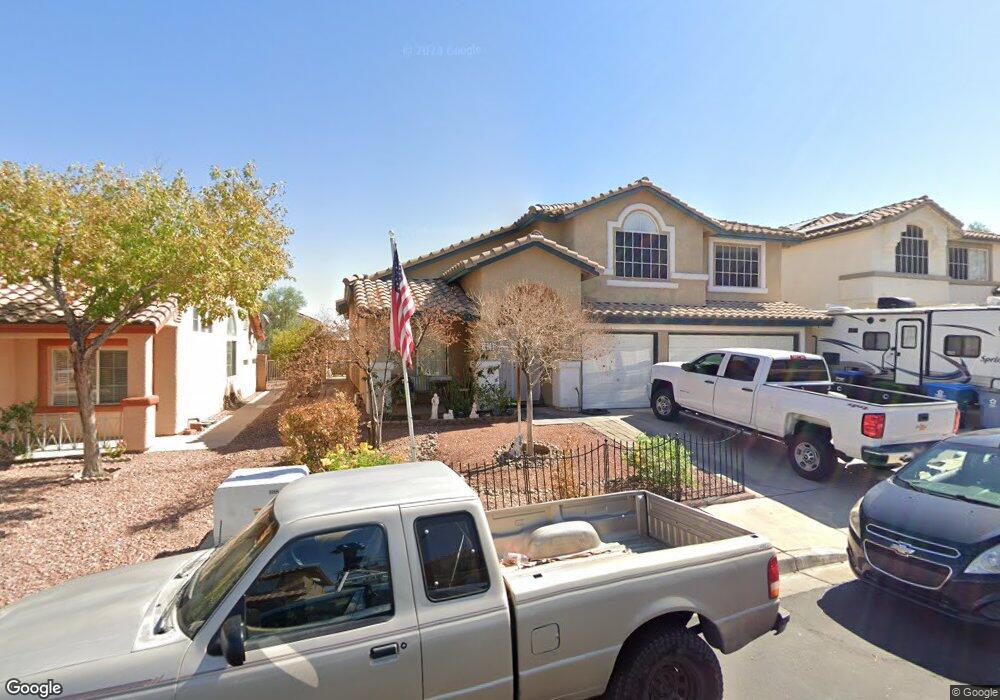
1030 Twin Berry Ct Henderson, NV 89002
Paradise Hills NeighborhoodEstimated Value: $553,116 - $614,000
4
Beds
4
Baths
2,924
Sq Ft
$198/Sq Ft
Est. Value
About This Home
This home is located at 1030 Twin Berry Ct, Henderson, NV 89002 and is currently estimated at $577,779, approximately $197 per square foot. 1030 Twin Berry Ct is a home located in Clark County with nearby schools including James E & A Rae Smalley Elementary School, Jack & Terry Mannion Middle School, and Foothill High School.
Ownership History
Date
Name
Owned For
Owner Type
Purchase Details
Closed on
Dec 10, 2019
Sold by
Dimuro Michael and Dimuro Adrienne
Bought by
Dimuro Michael S and Dimuro Adrienne
Current Estimated Value
Purchase Details
Closed on
Nov 7, 2001
Sold by
Dimuro Michael
Bought by
Dimuro Michael and Dimuro Adrienne
Home Financials for this Owner
Home Financials are based on the most recent Mortgage that was taken out on this home.
Original Mortgage
$155,000
Interest Rate
6.62%
Purchase Details
Closed on
Jan 31, 1997
Sold by
Lewis Properties
Bought by
Dimuro Michael
Home Financials for this Owner
Home Financials are based on the most recent Mortgage that was taken out on this home.
Original Mortgage
$143,400
Interest Rate
7.74%
Purchase Details
Closed on
Jan 14, 1997
Sold by
Dimuro Adrienne
Bought by
Dimuro Michael S
Home Financials for this Owner
Home Financials are based on the most recent Mortgage that was taken out on this home.
Original Mortgage
$143,400
Interest Rate
7.74%
Create a Home Valuation Report for This Property
The Home Valuation Report is an in-depth analysis detailing your home's value as well as a comparison with similar homes in the area
Home Values in the Area
Average Home Value in this Area
Purchase History
| Date | Buyer | Sale Price | Title Company |
|---|---|---|---|
| Dimuro Michael S | -- | None Available | |
| Dimuro Michael | -- | Old Republic Title Company | |
| Dimuro Michael | $179,500 | First American Title Co | |
| Dimuro Michael S | -- | First American Title Co |
Source: Public Records
Mortgage History
| Date | Status | Borrower | Loan Amount |
|---|---|---|---|
| Closed | Dimuro Michael | $155,000 | |
| Closed | Dimuro Michael | $143,400 |
Source: Public Records
Tax History Compared to Growth
Tax History
| Year | Tax Paid | Tax Assessment Tax Assessment Total Assessment is a certain percentage of the fair market value that is determined by local assessors to be the total taxable value of land and additions on the property. | Land | Improvement |
|---|---|---|---|---|
| 2025 | $2,278 | $122,673 | $32,200 | $90,473 |
| 2024 | $2,212 | $122,673 | $32,200 | $90,473 |
| 2023 | $2,212 | $124,641 | $38,500 | $86,141 |
| 2022 | $2,148 | $111,048 | $32,200 | $78,848 |
| 2021 | $2,086 | $105,605 | $30,450 | $75,155 |
| 2020 | $2,022 | $103,942 | $29,400 | $74,542 |
| 2019 | $1,963 | $99,679 | $25,900 | $73,779 |
| 2018 | $1,906 | $92,368 | $21,700 | $70,668 |
| 2017 | $2,691 | $92,824 | $21,000 | $71,824 |
| 2016 | $1,805 | $80,357 | $15,050 | $65,307 |
| 2015 | $1,801 | $69,332 | $11,200 | $58,132 |
| 2014 | $1,749 | $58,564 | $10,500 | $48,064 |
Source: Public Records
Map
Nearby Homes
- 1028 Twin Berry Ct
- 181 Ridge Crossing Ave
- 132 Westin Ln
- 641 Patti Ann Woods Dr
- 837 Holly Lake Way
- 322 Wintercress Dr
- 848 Coral Cottage Dr
- 1014 Pleasing Plateau St
- 503 Credence Ave
- 624 Monument Point St
- 510 Patti Ann Woods Dr
- 645 Monument Point St
- 860 Bergamont Dr
- 680 Moonlight Stroll St
- 653 Monument Point St
- 167 Desert Pond Ave
- 107 Mint Orchard Dr
- 1034 Copper Palm Ct
- 815 Crabapple Dr
- 688 Monument Point St
- 1032 Twin Berry Ct
- 1029 Spring Pond Ct
- 1031 Spring Pond Ct
- 1027 Spring Pond Ct
- 1034 Twin Berry Ct
- 1026 Twin Berry Ct
- 1029 Twin Berry Ct
- 1027 Twin Berry Ct
- 1033 Spring Pond Ct
- 1025 Spring Pond Ct
- 1031 Twin Berry Ct
- 1036 Twin Berry Ct
- 1025 Twin Berry Ct
- 1033 Twin Berry Ct
- 1035 Spring Pond Ct
- 1035 Twin Berry Ct
- 1038 Twin Berry Ct
- 1030 Yellow Marigold Ct
- 236 Trenier Dr
- 1028 Yellow Marigold Ct