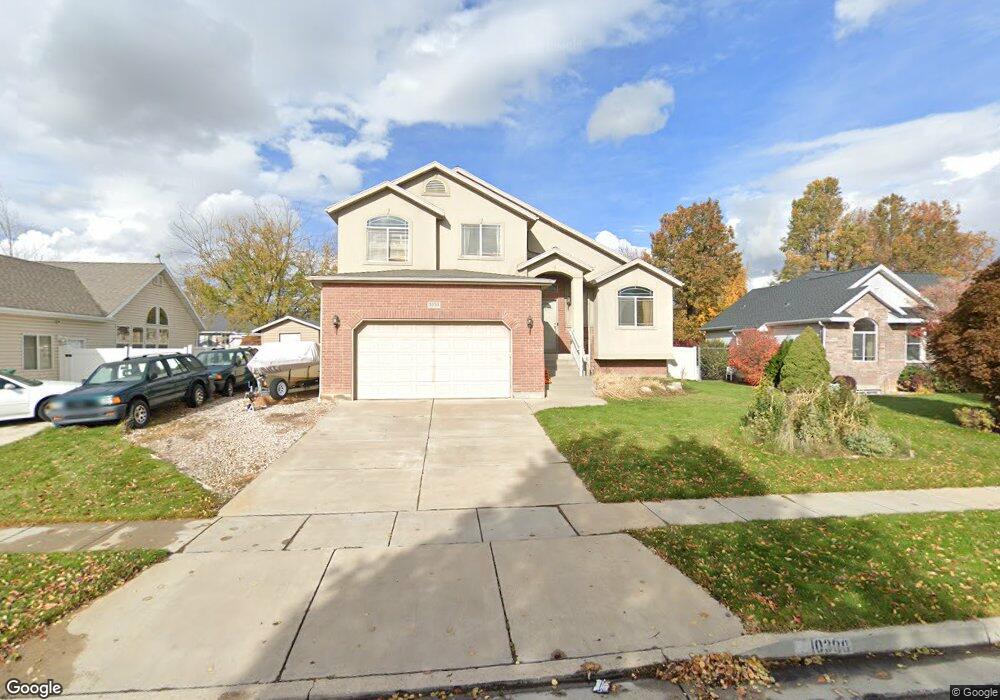
1030 W 400 S Layton, UT 84041
Estimated Value: $572,000 - $630,000
5
Beds
3
Baths
2,842
Sq Ft
$210/Sq Ft
Est. Value
About This Home
This home is located at 1030 W 400 S, Layton, UT 84041 and is currently estimated at $597,062, approximately $210 per square foot. 1030 W 400 S is a home located in Davis County with nearby schools including Layton Elementary School, Fairfield Junior High School, and Layton High School.
Ownership History
Date
Name
Owned For
Owner Type
Purchase Details
Closed on
Sep 29, 2005
Sold by
Aguayo Oscar
Bought by
Aguayo Oscar and Aguayo Jessica
Current Estimated Value
Home Financials for this Owner
Home Financials are based on the most recent Mortgage that was taken out on this home.
Original Mortgage
$180,000
Outstanding Balance
$95,391
Interest Rate
5.7%
Mortgage Type
New Conventional
Estimated Equity
$501,671
Purchase Details
Closed on
Jul 22, 2003
Sold by
Mckean Blain W and Mckean Jillian M
Bought by
Aguayo Oscar and Aguayo Jessica
Purchase Details
Closed on
Jan 8, 2000
Sold by
Preslar Brett J
Bought by
Mckean Blain W and Mckean Jillian M
Home Financials for this Owner
Home Financials are based on the most recent Mortgage that was taken out on this home.
Original Mortgage
$148,400
Interest Rate
8.06%
Purchase Details
Closed on
Nov 13, 1998
Sold by
Ten Angels Llc
Bought by
Preslar Brett J
Create a Home Valuation Report for This Property
The Home Valuation Report is an in-depth analysis detailing your home's value as well as a comparison with similar homes in the area
Home Values in the Area
Average Home Value in this Area
Purchase History
| Date | Buyer | Sale Price | Title Company |
|---|---|---|---|
| Aguayo Oscar | -- | First American Title | |
| Aguayo Oscar | -- | First American Title | |
| Aguayo Oscar | -- | Bonneville Title Company Inc | |
| Mckean Blain W | -- | Mountain View Title & Escrow | |
| Preslar Brett J | -- | Mountain View Title & Escrow |
Source: Public Records
Mortgage History
| Date | Status | Borrower | Loan Amount |
|---|---|---|---|
| Open | Aguayo Oscar | $180,000 | |
| Closed | Aguayo Oscar | $45,000 | |
| Previous Owner | Mckean Blain W | $148,400 |
Source: Public Records
Tax History Compared to Growth
Tax History
| Year | Tax Paid | Tax Assessment Tax Assessment Total Assessment is a certain percentage of the fair market value that is determined by local assessors to be the total taxable value of land and additions on the property. | Land | Improvement |
|---|---|---|---|---|
| 2025 | $2,709 | $284,350 | $108,938 | $175,412 |
| 2024 | $2,611 | $276,100 | $120,912 | $155,188 |
| 2023 | $2,565 | $478,000 | $118,831 | $359,169 |
| 2022 | $2,799 | $283,250 | $74,862 | $208,388 |
| 2021 | $2,458 | $371,000 | $112,323 | $258,677 |
| 2020 | $2,230 | $323,000 | $94,322 | $228,678 |
| 2019 | $2,179 | $309,000 | $97,366 | $211,634 |
| 2018 | $2,114 | $301,000 | $85,331 | $215,669 |
| 2016 | $1,904 | $139,866 | $33,226 | $106,640 |
| 2015 | $1,895 | $132,166 | $33,226 | $98,940 |
| 2014 | $2,067 | $147,388 | $33,226 | $114,162 |
| 2013 | -- | $109,622 | $21,772 | $87,850 |
Source: Public Records
Map
Nearby Homes
- 1015 W 350 S
- 362 S 950 W
- 296 S 950 W
- 562 S 850 W
- 557 S Angel St
- 933 W Gentile St
- 750 W Gentile St
- 774 W Farming Way
- 1042 W Shoreline Dr
- 1038 S Old Towne Rd
- 267 S Melody St
- 485 W 100 N
- Creighton Farmhouse Plan at Angel Hill
- 796 S Rock Creek Corner
- 355 W Gentile St
- 356 W 25 N
- 174 W Dawson St
- Browning Plan at Amber Fields
- Rhapsody Plan at Amber Fields
- Accord Plan at Amber Fields