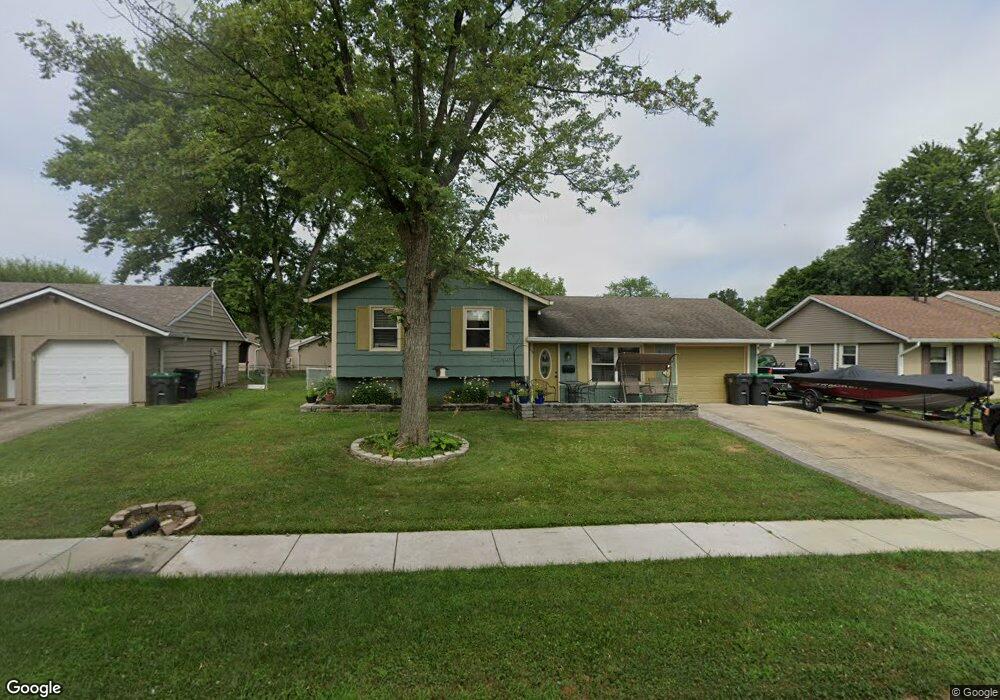
1030 Warwick Rd Whiteland, IN 46184
Estimated Value: $204,000 - $246,000
3
Beds
2
Baths
1,492
Sq Ft
$149/Sq Ft
Est. Value
About This Home
This home is located at 1030 Warwick Rd, Whiteland, IN 46184 and is currently estimated at $222,450, approximately $149 per square foot. 1030 Warwick Rd is a home located in Johnson County with nearby schools including Break-O-Day Elementary School, Clark-Pleasant Middle School, and Whiteland Community High School.
Ownership History
Date
Name
Owned For
Owner Type
Purchase Details
Closed on
Mar 11, 2021
Sold by
Dw Planker Inc
Bought by
Esque Alan and Esque Donna
Current Estimated Value
Home Financials for this Owner
Home Financials are based on the most recent Mortgage that was taken out on this home.
Original Mortgage
$4,445
Interest Rate
2.73%
Mortgage Type
New Conventional
Purchase Details
Closed on
Sep 2, 2016
Sold by
Planker Daniel W
Bought by
D W Planker Inc
Purchase Details
Closed on
May 18, 2009
Sold by
Nationstar Mortgage Llc
Bought by
Fannie Mae and Federal National Mortgage Association
Purchase Details
Closed on
Apr 16, 2009
Sold by
Goff Titus
Bought by
Nationstar Mortgage Llc
Create a Home Valuation Report for This Property
The Home Valuation Report is an in-depth analysis detailing your home's value as well as a comparison with similar homes in the area
Home Values in the Area
Average Home Value in this Area
Purchase History
| Date | Buyer | Sale Price | Title Company |
|---|---|---|---|
| Esque Alan | $127,000 | None Available | |
| D W Planker Inc | -- | None Available | |
| Fannie Mae | -- | None Available | |
| Nationstar Mortgage Llc | $137,663 | None Available |
Source: Public Records
Mortgage History
| Date | Status | Borrower | Loan Amount |
|---|---|---|---|
| Closed | Esque Alan | $4,445 | |
| Open | Esque Alan | $124,190 |
Source: Public Records
Tax History Compared to Growth
Tax History
| Year | Tax Paid | Tax Assessment Tax Assessment Total Assessment is a certain percentage of the fair market value that is determined by local assessors to be the total taxable value of land and additions on the property. | Land | Improvement |
|---|---|---|---|---|
| 2025 | $1,285 | $151,800 | $42,000 | $109,800 |
| 2024 | $1,285 | $144,400 | $42,000 | $102,400 |
| 2023 | $1,379 | $146,700 | $42,000 | $104,700 |
| 2022 | $1,361 | $135,200 | $35,000 | $100,200 |
| 2021 | $1,345 | $129,800 | $35,000 | $94,800 |
| 2020 | $2,135 | $101,700 | $23,500 | $78,200 |
| 2019 | $2,137 | $101,800 | $17,900 | $83,900 |
| 2018 | $2,052 | $100,500 | $15,100 | $85,400 |
| 2017 | $2,004 | $99,700 | $15,100 | $84,600 |
| 2016 | $1,744 | $90,200 | $15,100 | $75,100 |
| 2014 | $1,868 | $91,100 | $15,300 | $75,800 |
| 2013 | $1,868 | $93,400 | $15,300 | $78,100 |
Source: Public Records
Map
Nearby Homes
- 53 Oakden Ct
- 57 Oakden Ct
- 143 Tracy Ridge Blvd
- 190 Tracy Ridge Blvd
- 106 Tracy Ridge Blvd
- 256 Bittersweet Dr
- 6540 N Us Highway 31
- 638 Harvest Meadow Way
- 1119 Chateaugay Ct
- 840 Sweetbriar Ave
- 821 Princeton Dr
- 250 Southlane Dr
- 50 Meadow Creek Blvd
- 1041 Mount Olive Rd
- 111 Meadow Creek Blvd
- 559 Genisis Dr
- 0 E 700 N Unit MBR22036500
- 624 Sweetbriar Ave
- 539 Delbrook Dr
- 239 Shelton Place
- 1032 Warwick Rd
- 1028 Warwick Rd
- 1028 Warwick Rd Unit 1
- 1023 Ashland Ave
- 1034 Warwick Dr
- 1025 Ashland Ave
- 1021 Ashland Ave
- 1034 Warwick Rd
- 1026 Warwick Rd
- 1029 Warwick Rd
- 1019 Ashland Ave
- 1027 Ashland Ave
- 3 Peachtree Ln
- 1033 Warwick Rd
- 1036 Warwick Rd
- 1025 Warwick Rd
- 1024 Warwick Rd
- 1017 Ashland Ave
- 1029 Ashland Ave
- 1035 Warwick Rd