Estimated Value: $262,000 - $297,000
3
Beds
3
Baths
1,992
Sq Ft
$139/Sq Ft
Est. Value
About This Home
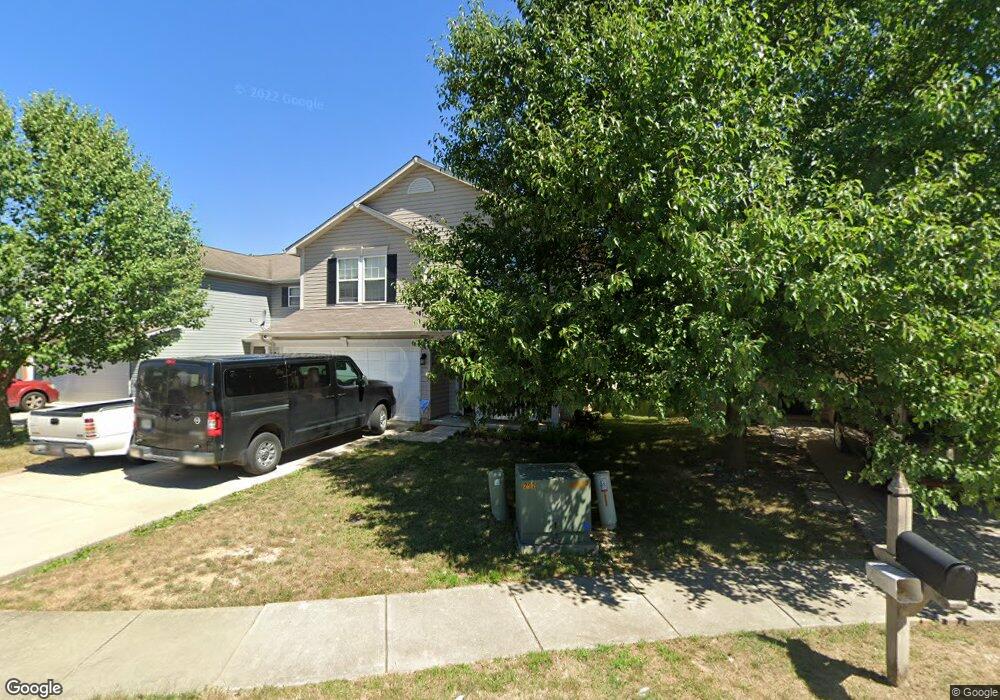
This home is located at 10300 Clear Sky Dr, Avon, IN 46123 and is currently estimated at $277,221, approximately $139 per square foot. 10300 Clear Sky Dr is a home located in Hendricks County with nearby schools including White Oak Elementary School, Pine Tree Elementary School, and Avon Intermediate School West.
Ownership History
Date
Name
Owned For
Owner Type
Purchase Details
Closed on
Jan 30, 2008
Sold by
Hsbc Mortgage Services Inc
Bought by
Harvey Craig E and Harvey Elizabeth C
Current Estimated Value
Home Financials for this Owner
Home Financials are based on the most recent Mortgage that was taken out on this home.
Original Mortgage
$107,000
Outstanding Balance
$66,390
Interest Rate
5.75%
Mortgage Type
New Conventional
Estimated Equity
$210,831
Purchase Details
Closed on
Jul 19, 2007
Sold by
Keller Elizabeth A and Sunchase Woods
Bought by
Hsbc Mortgage Servcies Inc
Purchase Details
Closed on
Jun 24, 2005
Sold by
Beazer Homes Indiana Llp
Bought by
Keller Elizabeth A
Home Financials for this Owner
Home Financials are based on the most recent Mortgage that was taken out on this home.
Original Mortgage
$25,750
Interest Rate
5.75%
Mortgage Type
Stand Alone Second
Create a Home Valuation Report for This Property
The Home Valuation Report is an in-depth analysis detailing your home's value as well as a comparison with similar homes in the area
Home Values in the Area
Average Home Value in this Area
Purchase History
| Date | Buyer | Sale Price | Title Company |
|---|---|---|---|
| Harvey Craig E | -- | None Available | |
| Hsbc Mortgage Servcies Inc | $106,647 | None Available | |
| Keller Elizabeth A | -- | None Available |
Source: Public Records
Mortgage History
| Date | Status | Borrower | Loan Amount |
|---|---|---|---|
| Open | Harvey Craig E | $107,000 | |
| Previous Owner | Keller Elizabeth A | $25,750 | |
| Previous Owner | Keller Elizabeth A | $103,050 |
Source: Public Records
Tax History Compared to Growth
Tax History
| Year | Tax Paid | Tax Assessment Tax Assessment Total Assessment is a certain percentage of the fair market value that is determined by local assessors to be the total taxable value of land and additions on the property. | Land | Improvement |
|---|---|---|---|---|
| 2024 | $2,715 | $245,800 | $39,400 | $206,400 |
| 2023 | $2,460 | $225,700 | $35,800 | $189,900 |
| 2022 | $2,270 | $203,100 | $32,000 | $171,100 |
| 2021 | $2,005 | $179,400 | $30,200 | $149,200 |
| 2020 | $1,815 | $164,900 | $30,200 | $134,700 |
| 2019 | $1,612 | $152,000 | $27,500 | $124,500 |
| 2018 | $1,680 | $147,500 | $27,500 | $120,000 |
| 2017 | $1,375 | $139,900 | $25,900 | $114,000 |
| 2016 | $1,362 | $136,200 | $25,900 | $110,300 |
| 2014 | $1,323 | $132,300 | $24,800 | $107,500 |
Source: Public Records
Map
Nearby Homes
- 813 Aerostar Ct
- 10064 Sundown Ln
- 10123 Morning Light Dr
- 10293 E County Road 100 S
- 9704 Porter Dr
- 606 Bakeway Cir
- 10699 Crane Dr
- 1256 Tenor Place
- 235 Avon Village Dr Unit Lot 184
- 403 Bagley Ln
- 9917 Countryside Ct
- 1249 Tenor Place
- 1422 Fortner Dr
- 1392 Broyles Ln
- 1449 Danielle Dr
- 9011 Walton St
- 257 Strand Ln Unit C
- 256 Strand Ln Unit C
- 8853 Stonewall Dr
- 1556 Danielle Dr
- 10292 Clear Sky Dr
- 10308 Clear Sky Dr
- 10284 Clear Sky Dr
- 10278 Clear Sky Dr
- 10312 Clear Sky Dr
- 216 Clear Sky Dr
- 10270 Clear Sky Dr
- 10293 Clear Sky Dr
- 521 Sun Catcher Dr
- 10262 Clear Sky Dr
- 527 Shining Star Ln
- 531 Sun Catcher Dr
- 10256 Clear Sky Dr
- 539 Shining Star Ln
- 548 Sun Catcher Dr
- 541 Sun Catcher Dr
- 547 Shining Star Ln
- 10248 Clear Sky Dr
- 554 Sun Catcher Dr
- 549 Sun Catcher Dr