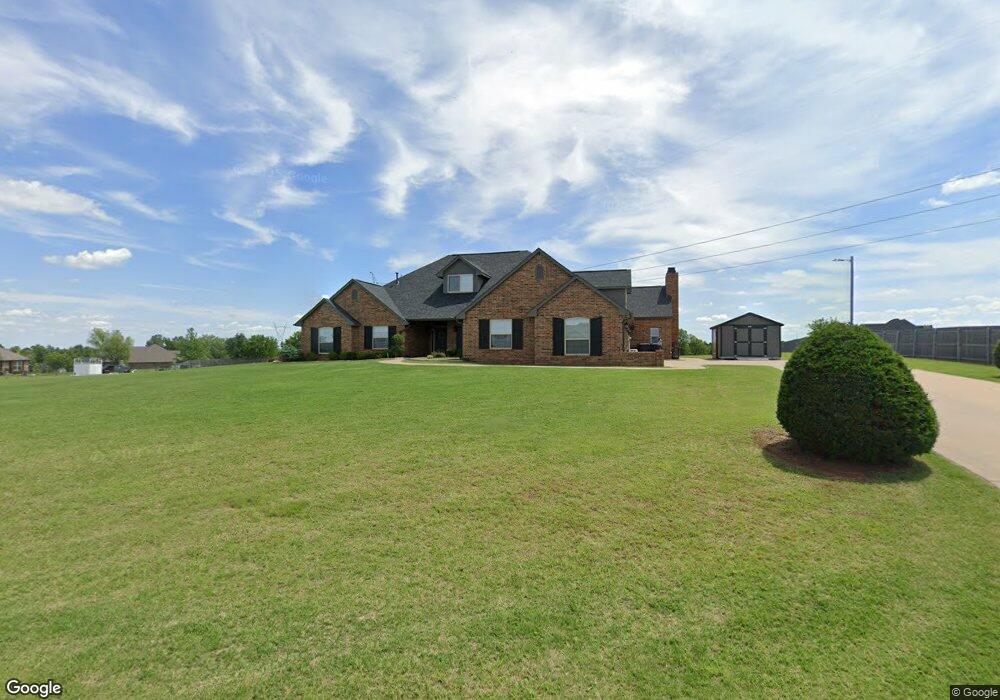
10300 Joseph Way Yukon, OK 73099
Surrey Hills NeighborhoodEstimated Value: $538,000 - $624,000
4
Beds
3
Baths
3,638
Sq Ft
$163/Sq Ft
Est. Value
About This Home
This home is located at 10300 Joseph Way, Yukon, OK 73099 and is currently estimated at $593,342, approximately $163 per square foot. 10300 Joseph Way is a home located in Canadian County with nearby schools including Northwood Elementary School, Piedmont Middle School, and Piedmont Intermediate Elementary School.
Ownership History
Date
Name
Owned For
Owner Type
Purchase Details
Closed on
Sep 27, 2013
Sold by
Brown Richard D and Brown Ardyce Elaine
Bought by
Hoisington Donel H and Hoisington Alysha C
Current Estimated Value
Home Financials for this Owner
Home Financials are based on the most recent Mortgage that was taken out on this home.
Original Mortgage
$319,900
Outstanding Balance
$241,496
Interest Rate
4.62%
Mortgage Type
New Conventional
Estimated Equity
$351,846
Purchase Details
Closed on
Jun 15, 2007
Sold by
Brown Richard D and Brown Elaine A
Bought by
Brown Richard D and Brown Ardyce Elaine
Home Financials for this Owner
Home Financials are based on the most recent Mortgage that was taken out on this home.
Original Mortgage
$292,000
Interest Rate
6.16%
Mortgage Type
New Conventional
Purchase Details
Closed on
Nov 29, 2005
Sold by
Cypert Claud and Cypert Betty K
Bought by
Brown Richard D and Brown Elaine A
Create a Home Valuation Report for This Property
The Home Valuation Report is an in-depth analysis detailing your home's value as well as a comparison with similar homes in the area
Home Values in the Area
Average Home Value in this Area
Purchase History
| Date | Buyer | Sale Price | Title Company |
|---|---|---|---|
| Hoisington Donel H | $340,000 | The Oklahoma City Abstract & | |
| Brown Richard D | -- | None Available | |
| Brown Richard D | $32,000 | None Available |
Source: Public Records
Mortgage History
| Date | Status | Borrower | Loan Amount |
|---|---|---|---|
| Open | Hoisington Donel H | $319,900 | |
| Previous Owner | Brown Richard D | $292,000 | |
| Closed | Brown Richard D | $0 |
Source: Public Records
Tax History Compared to Growth
Tax History
| Year | Tax Paid | Tax Assessment Tax Assessment Total Assessment is a certain percentage of the fair market value that is determined by local assessors to be the total taxable value of land and additions on the property. | Land | Improvement |
|---|---|---|---|---|
| 2024 | $5,872 | $50,992 | $4,200 | $46,792 |
| 2023 | $5,872 | $49,507 | $4,200 | $45,307 |
| 2022 | $5,778 | $48,065 | $4,200 | $43,865 |
| 2021 | $5,750 | $46,665 | $4,200 | $42,465 |
| 2020 | $5,693 | $45,306 | $4,200 | $41,106 |
| 2019 | $5,473 | $45,542 | $4,200 | $41,342 |
| 2018 | $4,963 | $40,896 | $4,200 | $36,696 |
| 2017 | $4,968 | $41,153 | $3,840 | $37,313 |
| 2016 | $4,653 | $40,989 | $3,840 | $37,149 |
| 2015 | -- | $38,790 | $3,840 | $34,950 |
| 2014 | -- | $39,126 | $3,840 | $35,286 |
Source: Public Records
Map
Nearby Homes
- 11013 NW 99th St
- 11016 NW 101st St
- 11112 NW 99th St
- 10300 Sundance Dr
- 9505 Sundance Ridge Rd
- 11225 NW 102nd St
- 11217 NW 98th St
- 10681 NW 107th St
- 11240 NW 102nd St
- 10808 NW 94th St
- 11240 NW 104th St
- 11016 NW 94th Terrace
- 11232 NW 105th St
- 11036 NW 94th St
- 9108 NW 117th St
- 10017 Allie Hope Ln
- 9320 Cheek Ranch Rd
- 11208 NW 95th St
- 9213 Taggert Ln
- 9900 Glover River Dr
- 9921 Eastblake Landing
- 9917 Eastblake Landing
- 10301 Joseph Way
- 10901 NW 99th St
- 10824 NW 103rd Cir
- 10812 NW 103rd Cir
- 10315 Joseph Way
- 10905 NW 99th St
- 10800 NW 103rd Cir
- 10325 Joseph Way
- 9913 Eastblake Landing Rd
- 10909 NW 99th St
- 9920 Eastblake Landing
- 10825 NW 103rd Cir
- 9901 Eastblake Place
- 10401 Joseph Way
- 9909 Eastblake Landing
- 10908 NW 99th St
- 9904 Eastblake Place
- 10815 NW 103rd Cir