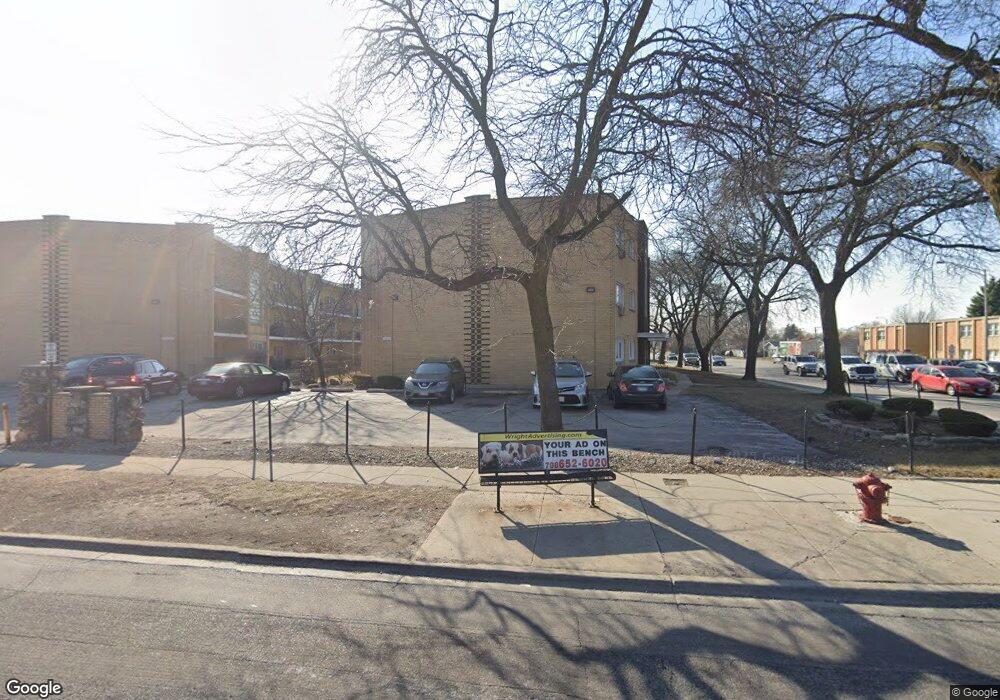
10300 S Pulaski Rd Unit 310A Oak Lawn, IL 60453
Estimated Value: $105,000 - $168,000
2
Beds
1
Bath
1,050
Sq Ft
$130/Sq Ft
Est. Value
About This Home
This home is located at 10300 S Pulaski Rd Unit 310A, Oak Lawn, IL 60453 and is currently estimated at $136,879, approximately $130 per square foot. 10300 S Pulaski Rd Unit 310A is a home located in Cook County with nearby schools including Kolmar Avenue Elementary School, Sward Elementary School, and Hometown Elementary School.
Ownership History
Date
Name
Owned For
Owner Type
Purchase Details
Closed on
Apr 24, 2017
Sold by
Mcdonnel Jennifer
Bought by
Cerda Gabriela
Current Estimated Value
Home Financials for this Owner
Home Financials are based on the most recent Mortgage that was taken out on this home.
Original Mortgage
$52,250
Outstanding Balance
$43,396
Interest Rate
4.14%
Mortgage Type
New Conventional
Estimated Equity
$93,483
Purchase Details
Closed on
Jun 8, 2001
Sold by
Mcdonald John
Bought by
Mcdonnell Jennifer
Home Financials for this Owner
Home Financials are based on the most recent Mortgage that was taken out on this home.
Original Mortgage
$67,000
Interest Rate
8.25%
Purchase Details
Closed on
Sep 27, 1999
Sold by
Rauscher Andrea L
Bought by
Mcdonald John
Home Financials for this Owner
Home Financials are based on the most recent Mortgage that was taken out on this home.
Original Mortgage
$60,800
Interest Rate
7.93%
Create a Home Valuation Report for This Property
The Home Valuation Report is an in-depth analysis detailing your home's value as well as a comparison with similar homes in the area
Home Values in the Area
Average Home Value in this Area
Purchase History
| Date | Buyer | Sale Price | Title Company |
|---|---|---|---|
| Cerda Gabriela | $55,000 | Fidelity National Title | |
| Mcdonnell Jennifer | $67,000 | -- | |
| Mcdonald John | $64,000 | First American Title |
Source: Public Records
Mortgage History
| Date | Status | Borrower | Loan Amount |
|---|---|---|---|
| Open | Cerda Gabriela | $52,250 | |
| Previous Owner | Mcdonnell Jennifer | $67,000 | |
| Previous Owner | Mcdonald John | $60,800 |
Source: Public Records
Tax History Compared to Growth
Tax History
| Year | Tax Paid | Tax Assessment Tax Assessment Total Assessment is a certain percentage of the fair market value that is determined by local assessors to be the total taxable value of land and additions on the property. | Land | Improvement |
|---|---|---|---|---|
| 2024 | $3,183 | $9,908 | $982 | $8,926 |
| 2023 | $2,611 | $9,908 | $982 | $8,926 |
| 2022 | $2,611 | $6,623 | $1,332 | $5,291 |
| 2021 | $2,541 | $6,623 | $1,332 | $5,291 |
| 2020 | $2,516 | $6,623 | $1,332 | $5,291 |
| 2019 | $2,786 | $7,268 | $1,227 | $6,041 |
| 2018 | $2,682 | $7,268 | $1,227 | $6,041 |
| 2017 | $1,455 | $7,268 | $1,227 | $6,041 |
| 2016 | $1,310 | $5,847 | $1,016 | $4,831 |
| 2015 | $1,243 | $5,847 | $1,016 | $4,831 |
| 2014 | $1,245 | $5,847 | $1,016 | $4,831 |
| 2013 | $1,153 | $5,993 | $1,016 | $4,977 |
Source: Public Records
Map
Nearby Homes
- 10314 S Komensky Ave Unit 3C
- 10418 S Pulaski Rd Unit 204C
- 10448 S Pulaski Rd
- 10126 S Pulaski Rd Unit P4
- 10110 S Pulaski Rd Unit 3W
- 10509 Kedvale Ave
- 10100 S Pulaski Rd Unit 1E
- 10048 S Pulaski Rd Unit 2B
- 10036 Kedvale Ave
- 10155 S Kildare Ave
- 10511 S Hamlin Ave
- 10420 S Kildare Ave
- 10002 S Pulaski Rd Unit 207
- 10001 Kedvale Ave
- 4000 W 107th St
- 10036 S Tripp Ave
- 10100 Kildare Ave
- 10528 S Lawndale Ave
- 10606 S Ridgeway Ave
- 3818 W 107th St
- 10300 S Pulaski Rd Unit 109A
- 10300 S Pulaski Rd Unit 110A
- 10300 S Pulaski Rd Unit 210A
- 10300 S Pulaski Rd Unit 309A
- 10316 S Pulaski Rd Unit 203A
- 10316 S Pulaski Rd Unit 303A
- 10316 S Pulaski Rd Unit 103A
- 10300 S Pulaski Rd Unit 209A
- 10300 S Pulaski St Unit 310
- 10328 S Pulaski Rd Unit 308
- 10328 S Pulaski Rd Unit 108
- 10328 S Pulaski Rd Unit 208
- 10332 S Pulaski Rd Unit 107
- 10332 S Pulaski Rd Unit 306
- 10332 S Pulaski Rd Unit 106
- 10332 S Pulaski Rd Unit 206
- 10332 S Pulaski Rd Unit 207
- 10324 S Pulaski Rd Unit 210
- 10324 S Pulaski Rd Unit 110
- 10324 S Pulaski Rd Unit 309