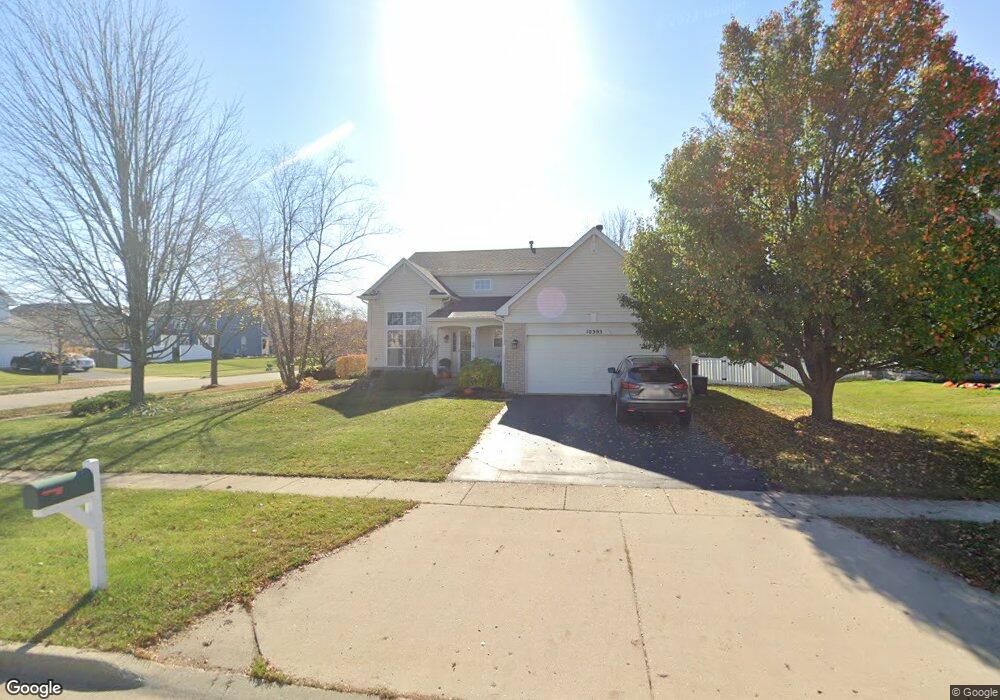
10305 Brighton Ln Huntley, IL 60142
Estimated Value: $390,000 - $447,000
3
Beds
3
Baths
1,899
Sq Ft
$215/Sq Ft
Est. Value
About This Home
This home is located at 10305 Brighton Ln, Huntley, IL 60142 and is currently estimated at $408,655, approximately $215 per square foot. 10305 Brighton Ln is a home located in McHenry County with nearby schools including Martin Elementary School, Chesak Elementary School, and Marlowe Middle School.
Ownership History
Date
Name
Owned For
Owner Type
Purchase Details
Closed on
Feb 21, 2017
Sold by
Smidt David M and Smidt Jennifer
Bought by
Mcguigan Brian
Current Estimated Value
Home Financials for this Owner
Home Financials are based on the most recent Mortgage that was taken out on this home.
Original Mortgage
$7,500
Outstanding Balance
$6,238
Interest Rate
4.19%
Mortgage Type
Unknown
Estimated Equity
$402,417
Purchase Details
Closed on
Jan 28, 2010
Sold by
Wood Christopher L and Wood Karen S
Bought by
Smidt David M and Smidt Jennifer
Home Financials for this Owner
Home Financials are based on the most recent Mortgage that was taken out on this home.
Original Mortgage
$206,196
Interest Rate
4.87%
Mortgage Type
FHA
Purchase Details
Closed on
Dec 1, 1999
Sold by
Drh Cambridge Homes Inc
Bought by
Wood Christopher L and Wood Karen S
Home Financials for this Owner
Home Financials are based on the most recent Mortgage that was taken out on this home.
Original Mortgage
$179,400
Interest Rate
7.97%
Create a Home Valuation Report for This Property
The Home Valuation Report is an in-depth analysis detailing your home's value as well as a comparison with similar homes in the area
Home Values in the Area
Average Home Value in this Area
Purchase History
| Date | Buyer | Sale Price | Title Company |
|---|---|---|---|
| Mcguigan Brian | $247,000 | Chicago Title | |
| Smidt David M | $214,000 | Fatic | |
| Wood Christopher L | $214,000 | First American |
Source: Public Records
Mortgage History
| Date | Status | Borrower | Loan Amount |
|---|---|---|---|
| Open | Mcguigan Brian | $7,500 | |
| Open | Mcguigan Brian | $242,526 | |
| Previous Owner | Smidt David M | $206,196 | |
| Previous Owner | Wood Christopher L | $179,400 |
Source: Public Records
Tax History Compared to Growth
Tax History
| Year | Tax Paid | Tax Assessment Tax Assessment Total Assessment is a certain percentage of the fair market value that is determined by local assessors to be the total taxable value of land and additions on the property. | Land | Improvement |
|---|---|---|---|---|
| 2024 | $9,272 | $109,236 | $6,989 | $102,247 |
| 2023 | $9,108 | $98,128 | $6,278 | $91,850 |
| 2022 | $8,814 | $89,354 | $5,717 | $83,637 |
| 2021 | $8,521 | $84,153 | $5,384 | $78,769 |
| 2020 | $8,258 | $81,908 | $5,240 | $76,668 |
| 2019 | $8,060 | $79,817 | $5,106 | $74,711 |
| 2018 | $7,775 | $75,394 | $5,747 | $69,647 |
| 2017 | $7,611 | $71,053 | $5,416 | $65,637 |
| 2016 | $7,990 | $67,554 | $5,149 | $62,405 |
| 2013 | -- | $63,147 | $14,608 | $48,539 |
Source: Public Records
Map
Nearby Homes
- 10117 Dunhill Dr
- 10549 Wakefield Ln
- 390 Windermere Way
- 5538 Alexandria Dr
- 2571 Stanton Cir
- 2331 Claremont Ln
- 441 Wright Dr
- 2350 Stanton Cir
- 210 Ellis Rd
- 10434 Casselberry S
- 131 S Annandale Dr
- 2 Melbourne Ct
- 10804 Concord Ln
- 2191 Litchfield Ln
- 10000 Berkshire Ln
- 2521 Waterford Ln
- 10631 Oregon Trail
- 9204 Haligus Rd
- 10419 Evendale Rd
- 10880 Potomac Dr
- 10307 Brighton Ln
- 10300 Ashley St
- 10310 Ashley St
- 10317 Brighton Ln
- 10306 Brighton Ln
- 10030 Wellington Dr
- 10318 Ashley St
- 10010 Wellington Dr
- 10176 Ashley St
- 10308 Brighton Ln
- 10319 Brighton Ln
- 10316 Brighton Ln
- 10320 Ashley St
- 10171 Bennington Dr
- 10168 Ashley St
- 10187 Bennington Dr
- 10318 Brighton Ln
- 10327 Brighton Ln
- 10167 Bennington Dr
- 10301 Ashley St