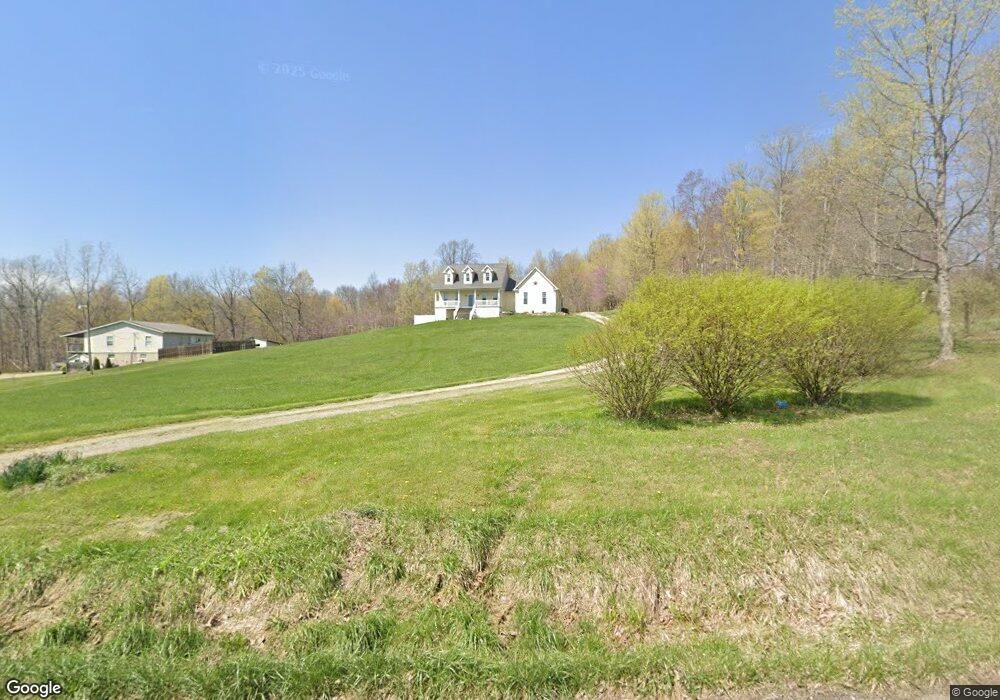
10305 N Greer Rd NW McConnelsville, OH 43756
Estimated Value: $202,000 - $306,214
3
Beds
3
Baths
2,853
Sq Ft
$86/Sq Ft
Est. Value
About This Home
This home is located at 10305 N Greer Rd NW, McConnelsville, OH 43756 and is currently estimated at $246,554, approximately $86 per square foot. 10305 N Greer Rd NW is a home located in Morgan County with nearby schools including Morgan High School.
Ownership History
Date
Name
Owned For
Owner Type
Purchase Details
Closed on
Jun 25, 2019
Sold by
Mayle Brian K and Clifton Joni
Bought by
Hartfield Mark T and Hartfield Felicia
Current Estimated Value
Purchase Details
Closed on
Jun 30, 2017
Sold by
Hall Karey A and Mayle Karey A
Bought by
Mayle Brian K
Purchase Details
Closed on
Apr 3, 2013
Sold by
Mayle Brian K
Bought by
Mayle Brian K and Mayle Karey A
Purchase Details
Closed on
Jun 10, 2009
Sold by
Miller Kippy Lee and Miller Nancy Lavayne
Bought by
Mayle Brian K
Home Financials for this Owner
Home Financials are based on the most recent Mortgage that was taken out on this home.
Original Mortgage
$163,440
Interest Rate
4.92%
Mortgage Type
VA
Purchase Details
Closed on
May 13, 2004
Sold by
Miller Barbara A and Lee Kristafal
Bought by
Miller Barbara A and Kristafal Lee
Purchase Details
Closed on
Mar 8, 2002
Bought by
National Nominee Group Inc
Create a Home Valuation Report for This Property
The Home Valuation Report is an in-depth analysis detailing your home's value as well as a comparison with similar homes in the area
Home Values in the Area
Average Home Value in this Area
Purchase History
| Date | Buyer | Sale Price | Title Company |
|---|---|---|---|
| Hartfield Mark T | $190,000 | None Available | |
| Mayle Brian K | -- | None Available | |
| Mayle Brian K | -- | None Available | |
| Mayle Brian K | $160,000 | None Available | |
| Miller Barbara A | $14,900 | -- | |
| National Nominee Group Inc | -- | -- |
Source: Public Records
Mortgage History
| Date | Status | Borrower | Loan Amount |
|---|---|---|---|
| Previous Owner | Mayle Brian K | $163,440 |
Source: Public Records
Tax History Compared to Growth
Tax History
| Year | Tax Paid | Tax Assessment Tax Assessment Total Assessment is a certain percentage of the fair market value that is determined by local assessors to be the total taxable value of land and additions on the property. | Land | Improvement |
|---|---|---|---|---|
| 2024 | $2,446 | $75,640 | $14,950 | $60,690 |
| 2023 | $1,843 | $57,660 | $12,180 | $45,480 |
| 2022 | $1,845 | $57,660 | $12,180 | $45,480 |
| 2021 | $1,865 | $57,660 | $12,180 | $45,480 |
| 2019 | $1,761 | $53,220 | $11,070 | $42,150 |
| 2018 | $1,691 | $53,220 | $11,070 | $42,150 |
| 2017 | $1,444 | $44,395 | $7,207 | $37,188 |
| 2016 | $1,449 | $44,395 | $7,207 | $37,188 |
| 2015 | $1,448 | $44,395 | $7,207 | $37,188 |
| 2014 | $1,493 | $44,395 | $7,207 | $37,188 |
| 2013 | $1,472 | $44,395 | $7,207 | $37,188 |
Source: Public Records
Map
Nearby Homes
- 9950 N Greer Rd NW
- 9371 Mautz Dr
- 8752 N Rokeby Dr NW
- 8258 N State Route 60 NW
- 9815 Old River Rd
- 9390 Shady Ln
- 5780 Henderson St
- 7405 W Sharps Ridge Rd NW
- 280 Virginia Ridge Rd
- 6711 N State Route 60 NW
- 1285 Moody Hollow Rd
- 8285 Old River Rd
- 9615 Rural Dale Rd
- 5975 Helaman Ln
- 7979 Old River Rd
- 0 Wilbur Bush Rd NW
- 7515 Pioneer Dr
- 10285 Dozer Ridge Road-Tract 1
- 10285 Dozer Ridge Rd
- 0 F B Eye Rd Unit 5166224
- 10295 N Greer Rd NW
- 10290 N Greer Rd NW
- 10285 N Greer Rd NW
- 10275 N Greer Rd NW
- 10250 N Greer Rd NW
- 10235 N Greer Rd NW
- 10639 Pisgah Ridge Rd
- 10190 N Greer Rd NW
- 10151 N Pisgah Ridge Rd NW
- 10145 N Greer Rd NW
- 10697 Pisgah Ridge Rd
- 10110 N Pisgah Ridge Rd NW
- 3378 W White Rd NW
- 3390 W White Rd NW
- 10115 N Greer Rd NW
- 10225 Pierson Ln
- 10085 N Greer Rd NW
- 10650 Pisgah Ridge Rd
- 10760 Pisgah Ridge Rd
- 10805 Pisgah Ridge Rd