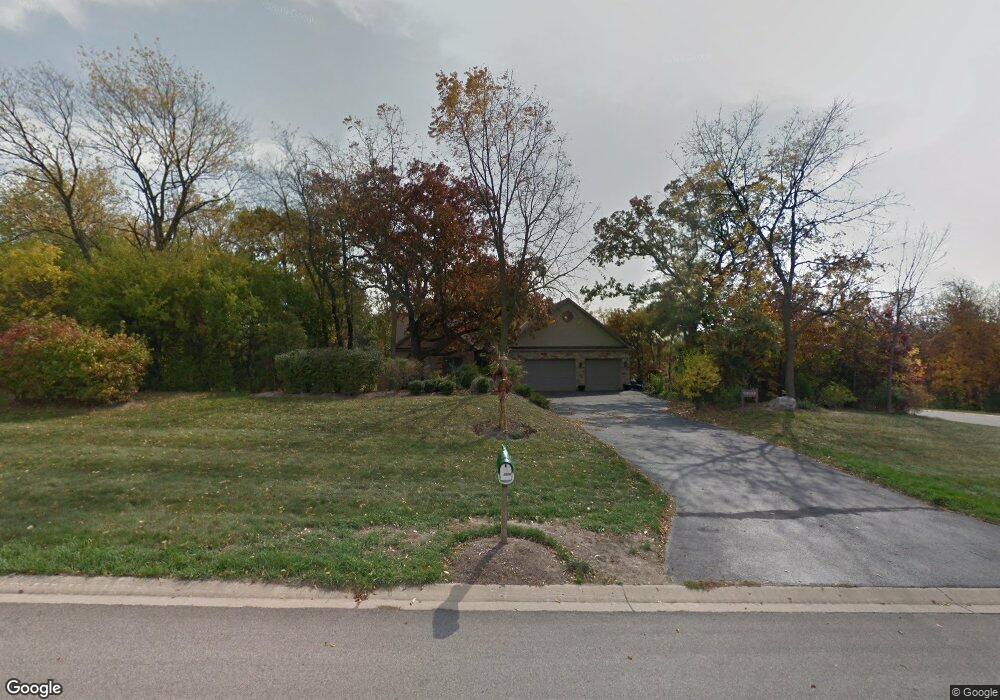
10306 Fox Bluff Ln Spring Grove, IL 60081
Estimated Value: $426,096 - $524,000
3
Beds
--
Bath
2,140
Sq Ft
$229/Sq Ft
Est. Value
About This Home
This home is located at 10306 Fox Bluff Ln, Spring Grove, IL 60081 and is currently estimated at $491,024, approximately $229 per square foot. 10306 Fox Bluff Ln is a home located in McHenry County with nearby schools including Richmond Grade School, Nippersink Middle School, and Richmond-Burton High School.
Ownership History
Date
Name
Owned For
Owner Type
Purchase Details
Closed on
Apr 25, 2002
Sold by
Roedel Carl P and Vidmar Stefanie J
Bought by
Roedel Carl P and Roedel Stefanie J
Current Estimated Value
Home Financials for this Owner
Home Financials are based on the most recent Mortgage that was taken out on this home.
Original Mortgage
$239,000
Outstanding Balance
$100,066
Interest Rate
6.95%
Estimated Equity
$390,958
Purchase Details
Closed on
Jun 21, 2000
Sold by
Chicago Title Land Trust Company
Bought by
Roedel Carl P and Vidmar Stefanie J
Home Financials for this Owner
Home Financials are based on the most recent Mortgage that was taken out on this home.
Original Mortgage
$45,200
Interest Rate
8%
Create a Home Valuation Report for This Property
The Home Valuation Report is an in-depth analysis detailing your home's value as well as a comparison with similar homes in the area
Home Values in the Area
Average Home Value in this Area
Purchase History
| Date | Buyer | Sale Price | Title Company |
|---|---|---|---|
| Roedel Carl P | -- | Chicago Title Insurance Co | |
| Roedel Carl P | $56,500 | Chicago Title |
Source: Public Records
Mortgage History
| Date | Status | Borrower | Loan Amount |
|---|---|---|---|
| Open | Roedel Carl P | $239,000 | |
| Closed | Roedel Carl P | $45,200 |
Source: Public Records
Tax History
| Year | Tax Paid | Tax Assessment Tax Assessment Total Assessment is a certain percentage of the fair market value that is determined by local assessors to be the total taxable value of land and additions on the property. | Land | Improvement |
|---|---|---|---|---|
| 2024 | $8,995 | $125,613 | $24,399 | $101,214 |
| 2023 | $8,737 | $114,831 | $22,305 | $92,526 |
| 2022 | $8,436 | $103,396 | $20,084 | $83,312 |
| 2021 | $7,920 | $96,415 | $19,276 | $77,139 |
| 2020 | $7,793 | $92,769 | $18,547 | $74,222 |
| 2019 | $7,702 | $89,788 | $17,951 | $71,837 |
| 2018 | $7,767 | $86,078 | $17,209 | $68,869 |
| 2017 | $7,765 | $81,971 | $16,388 | $65,583 |
| 2016 | $7,641 | $76,853 | $15,365 | $61,488 |
| 2013 | -- | $72,664 | $14,527 | $58,137 |
Source: Public Records
Map
Nearby Homes
- 2102 W Hunters Ln
- 1914 Spring Dale Dr
- 11013 Serenity Path
- 2919 Il Route 173
- 11101 Serenity Path
- 10905 Breezy Lawn Rd
- 9436 Bellaire Ln
- 11111 Huron Dr
- 10105 N Clark Rd
- 11106 Siedschlag Rd
- Lot 16 Harding
- Lot 17 & 18 Harding Ave
- Lt1 Majestic Way W
- 3159 E Lakeshore Dr
- Lt17 Majestic Way E
- 2214 Main Street Rd
- 2611 E Lake Shore Dr
- 8610 Steeple Ln
- 8501 Country Shire Ln
- Lot 65,66,&64 Main Street Rd
- 10310 Fox Bluff Ln
- 2112 Ascot Ln
- 2205 Ascot Ln
- 10309 Fox Bluff Ln
- 10318 Fox Bluff Ln Unit 3
- 10218 Fox Bluff Ln
- 10315 Fox Bluff Ln
- 10303 Fox Bluff Ln Unit 3
- 2117 Ascot Ln
- 10212 Fox Bluff Ln
- 2102 Ascot Ln
- 10407 Fox Bluff Ln
- 2307 Falcon Ln
- 10404 Fox Bluff Ln
- 2109 Ascot Ln
- 10215 Fox Bluff Ln
- 2217 Falcon Ln
- 2311 Falcon Ln
- 10202 Fox Bluff Ln Unit 1
- 2101 Ascot Ln
Your Personal Tour Guide
Ask me questions while you tour the home.