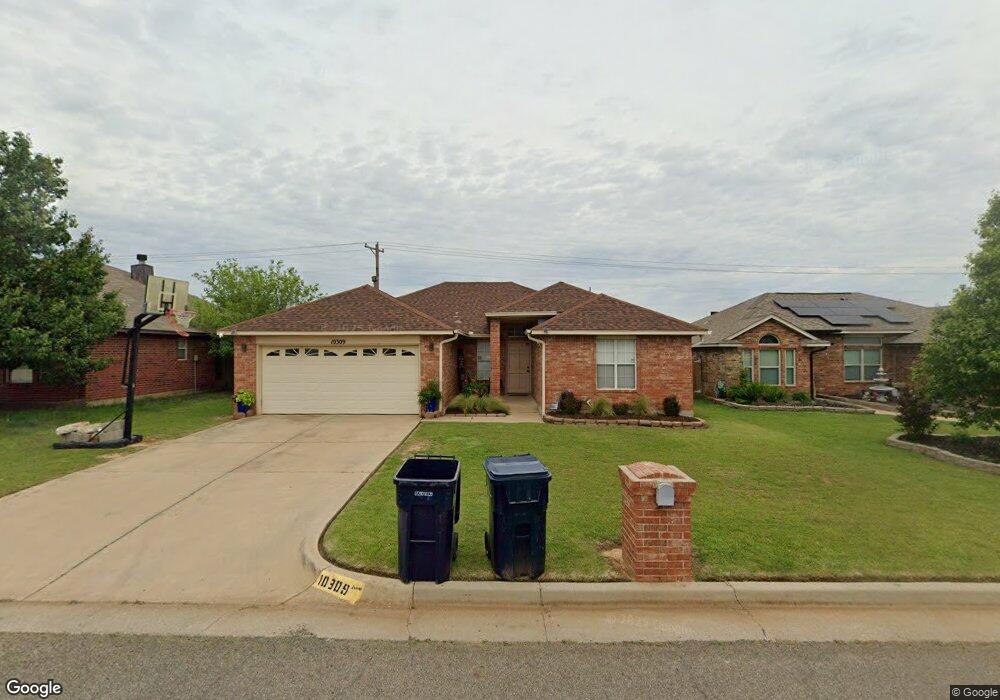
10309 Aberdeen Dr Yukon, OK 73099
Westbury NeighborhoodEstimated Value: $226,000 - $234,000
3
Beds
2
Baths
1,611
Sq Ft
$143/Sq Ft
Est. Value
About This Home
This home is located at 10309 Aberdeen Dr, Yukon, OK 73099 and is currently estimated at $230,069, approximately $142 per square foot. 10309 Aberdeen Dr is a home located in Canadian County with nearby schools including Mustang Creek Elementary School, Canyon Ridge Intermediate School, and Mustang North Middle School.
Ownership History
Date
Name
Owned For
Owner Type
Purchase Details
Closed on
Feb 29, 2008
Sold by
Jacob Varghese and Jacob Annamma A
Bought by
Williams Coley and Williams Nikki Yuvonne
Current Estimated Value
Home Financials for this Owner
Home Financials are based on the most recent Mortgage that was taken out on this home.
Original Mortgage
$127,078
Outstanding Balance
$78,014
Interest Rate
5.47%
Mortgage Type
FHA
Estimated Equity
$152,055
Purchase Details
Closed on
Oct 17, 2007
Sold by
Varughese Moncy and Varughese Rosamma
Bought by
Jacob Varghese and Varghese Saji
Purchase Details
Closed on
Aug 31, 2001
Sold by
Leonhardt Enterprises
Purchase Details
Closed on
Oct 15, 1999
Sold by
Westbury Investors Llc
Purchase Details
Closed on
Jun 19, 1996
Sold by
Sw Title & Trust Co Trustee
Purchase Details
Closed on
Dec 20, 1994
Sold by
Westbury Dev Corp Llc
Purchase Details
Closed on
Nov 19, 1993
Sold by
Westbury Dev Corp
Create a Home Valuation Report for This Property
The Home Valuation Report is an in-depth analysis detailing your home's value as well as a comparison with similar homes in the area
Home Values in the Area
Average Home Value in this Area
Purchase History
| Date | Buyer | Sale Price | Title Company |
|---|---|---|---|
| Williams Coley | $96,750 | None Available | |
| Jacob Varghese | $78,375 | None Available | |
| -- | $102,500 | -- | |
| -- | $16,500 | -- | |
| -- | $270,000 | -- | |
| -- | -- | -- | |
| -- | -- | -- |
Source: Public Records
Mortgage History
| Date | Status | Borrower | Loan Amount |
|---|---|---|---|
| Open | Williams Coley | $127,078 |
Source: Public Records
Tax History Compared to Growth
Tax History
| Year | Tax Paid | Tax Assessment Tax Assessment Total Assessment is a certain percentage of the fair market value that is determined by local assessors to be the total taxable value of land and additions on the property. | Land | Improvement |
|---|---|---|---|---|
| 2024 | $1,872 | $18,063 | $1,980 | $16,083 |
| 2023 | $1,872 | $17,537 | $1,980 | $15,557 |
| 2022 | $1,842 | $17,027 | $1,980 | $15,047 |
| 2021 | $1,855 | $17,203 | $1,980 | $15,223 |
| 2020 | $1,895 | $17,379 | $1,980 | $15,399 |
| 2019 | $1,862 | $17,113 | $1,980 | $15,133 |
| 2018 | $1,838 | $16,615 | $1,980 | $14,635 |
| 2017 | $1,815 | $16,625 | $1,980 | $14,645 |
| 2016 | $1,754 | $16,521 | $1,980 | $14,541 |
| 2015 | $1,670 | $15,670 | $1,980 | $13,690 |
| 2014 | $1,670 | $15,301 | $1,980 | $13,321 |
Source: Public Records
Map
Nearby Homes
- 10041 Aberdeen Ln
- 10321 Exter Ave
- 10210 Exter Ave
- 10340 Exter Ave
- 10509 Aberdeen Dr
- 10428 Fairfax Ln
- 10412 Dover Dr
- 10329 Kendal Ave
- 1417 Mayer Dr
- 10001 Hollyhead Way
- 1813 Bonnycastle Ln
- 11805 Edi Ave
- 9716 Blue Bonnet Place
- 2105 Bonnycastle Ln
- 9936 Birkenhead Ct
- 10037 Saint Helens Dr
- 10116 Thompson Ave
- 2138 Edinburg Dr
- 1701 Everglade Ct
- 2122 Edinburg Dr
- 10313 Aberdeen Dr
- 10305 Aberdeen Dr
- 10317 Aberdeen Dr
- 10301 Aberdeen Dr
- 10308 Aberdeen Dr
- 10312 Aberdeen Dr
- 10304 Aberdeen Dr
- 10321 Aberdeen Dr
- 10316 Aberdeen Dr
- 10233 Aberdeen Dr
- 10300 Aberdeen Dr
- 10320 Aberdeen Dr
- 10229 Aberdeen Dr
- 10325 Aberdeen Dr
- 901 Banff Cir
- 900 Banff Cir
- 10228 Aberdeen Dr
- 10324 Aberdeen Dr
- 10329 Aberdeen Dr
- 905 Banff Cir