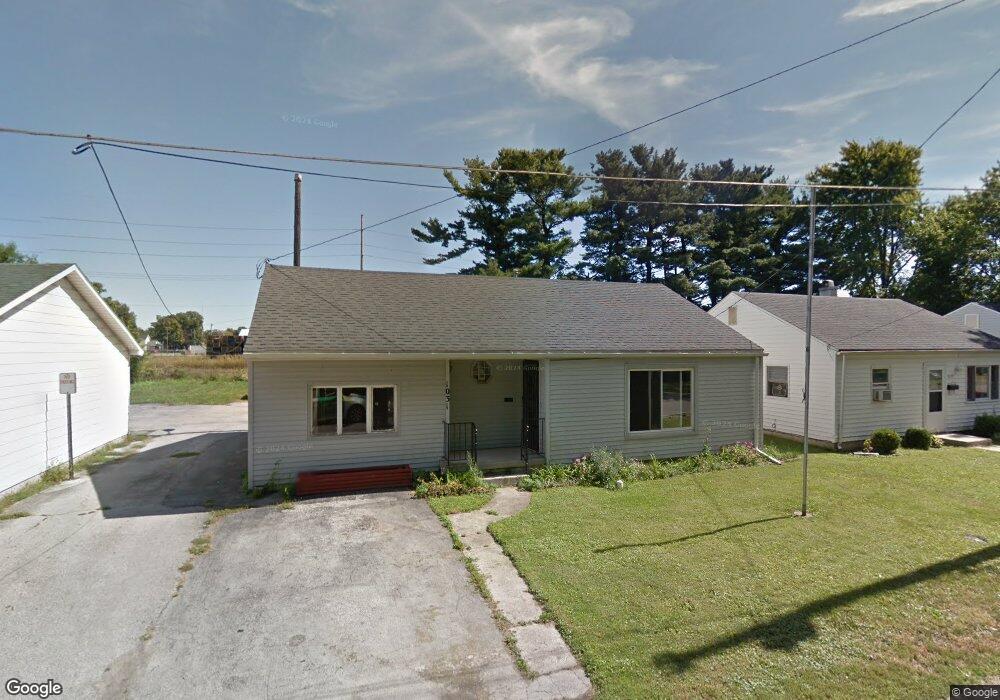
1031 Cedar Ave Findlay, OH 45840
Estimated Value: $111,000 - $139,000
3
Beds
1
Bath
1,204
Sq Ft
$105/Sq Ft
Est. Value
About This Home
This home is located at 1031 Cedar Ave, Findlay, OH 45840 and is currently estimated at $125,880, approximately $104 per square foot. 1031 Cedar Ave is a home located in Hancock County with nearby schools including Whittier Primary School, Bigelow Hill Elementary School, and Glenwood Middle School.
Ownership History
Date
Name
Owned For
Owner Type
Purchase Details
Closed on
Mar 28, 2008
Sold by
Gibson Larry and Gibson Joyce L
Bought by
Breiholz Douglas M
Current Estimated Value
Home Financials for this Owner
Home Financials are based on the most recent Mortgage that was taken out on this home.
Original Mortgage
$66,000
Outstanding Balance
$42,091
Interest Rate
6.1%
Mortgage Type
Purchase Money Mortgage
Estimated Equity
$83,789
Purchase Details
Closed on
Jan 20, 2004
Sold by
Gibson Larry
Bought by
Gibson Larry and Gibson Joyce L
Purchase Details
Closed on
Mar 15, 2002
Sold by
Jackson Claude
Bought by
Gibson Larry
Purchase Details
Closed on
May 19, 1992
Bought by
Jackson Claude
Purchase Details
Closed on
Sep 4, 1990
Bought by
Williams Mike W and Williams Kim E
Purchase Details
Closed on
Jun 26, 1986
Bought by
Ball Yvonne J
Create a Home Valuation Report for This Property
The Home Valuation Report is an in-depth analysis detailing your home's value as well as a comparison with similar homes in the area
Home Values in the Area
Average Home Value in this Area
Purchase History
| Date | Buyer | Sale Price | Title Company |
|---|---|---|---|
| Breiholz Douglas M | $66,000 | Golden Key Title Agency | |
| Gibson Larry | -- | Midam Title | |
| Gibson Larry | $53,500 | -- | |
| Jackson Claude | $49,000 | -- | |
| Williams Mike W | $35,000 | -- | |
| Ball Yvonne J | -- | -- |
Source: Public Records
Mortgage History
| Date | Status | Borrower | Loan Amount |
|---|---|---|---|
| Open | Breiholz Douglas M | $66,000 |
Source: Public Records
Tax History
| Year | Tax Paid | Tax Assessment Tax Assessment Total Assessment is a certain percentage of the fair market value that is determined by local assessors to be the total taxable value of land and additions on the property. | Land | Improvement |
|---|---|---|---|---|
| 2024 | $1,135 | $31,960 | $3,870 | $28,090 |
| 2023 | $1,137 | $31,960 | $3,870 | $28,090 |
| 2022 | $1,133 | $31,960 | $3,870 | $28,090 |
| 2021 | $1,004 | $24,670 | $3,870 | $20,800 |
| 2020 | $1,004 | $24,670 | $3,870 | $20,800 |
| 2019 | $984 | $24,670 | $3,870 | $20,800 |
| 2018 | $940 | $21,620 | $3,370 | $18,250 |
| 2017 | $470 | $21,620 | $3,370 | $18,250 |
| 2016 | $937 | $21,620 | $3,370 | $18,250 |
| 2015 | $1,143 | $26,150 | $3,370 | $22,780 |
| 2014 | $1,144 | $26,150 | $3,370 | $22,780 |
| 2012 | $1,152 | $26,150 | $3,370 | $22,780 |
Source: Public Records
Map
Nearby Homes
- 204 Laquineo St
- 322 Midland Ave
- 301 Allen Ave
- 206 Midland Ave
- 706 N Cory St
- 145 Madison Ave
- 1500 Crystal Ave
- 140 Monroe Ave
- 420 H St
- 1820 Gayle Ln
- 716 Winfield Ave
- 146 Clifton Ave
- 213 Cherry St
- 912 Parkside Place
- 1062 Vincent St
- 232 Prentiss Ave
- 421 Clifton Ave
- 523 Center St
- 439 Carnahan Ave
- 1142 Concord Ct
- 1029 Cedar Ave
- 1025 Cedar Ave
- 241 George St
- 225 George St
- 1030 Cedar Ave
- 1026 Cedar Ave
- 1015 Cedar Ave
- 1020 Cedar Ave
- 223 George St
- 1016 Cedar Ave
- 221 George St
- 1012 Cedar Ave
- 219 George St
- 234 George St
- 240 George St
- 236 Laquineo St
- 224 Laquineo St
- 224 George St Unit 224
- 224 George St Unit 222
- 226 George St
Your Personal Tour Guide
Ask me questions while you tour the home.