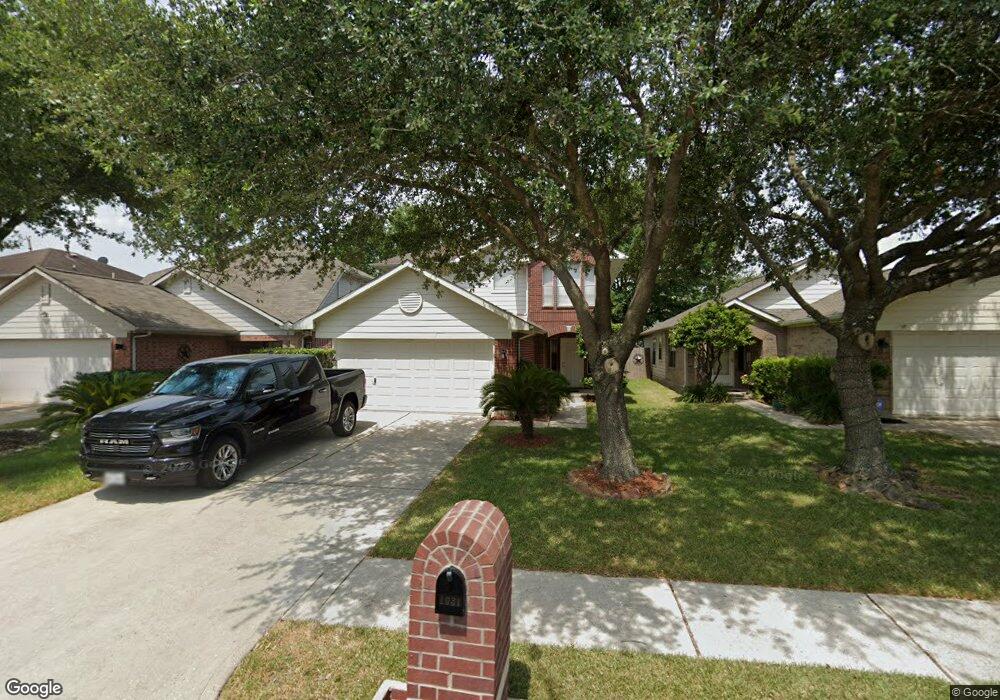
1031 Deerpass Dr Channelview, TX 77530
Estimated Value: $244,472 - $270,000
4
Beds
3
Baths
1,832
Sq Ft
$140/Sq Ft
Est. Value
About This Home
This home is located at 1031 Deerpass Dr, Channelview, TX 77530 and is currently estimated at $256,368, approximately $139 per square foot. 1031 Deerpass Dr is a home located in Harris County with nearby schools including Channelview High School and Family Christian Academy.
Ownership History
Date
Name
Owned For
Owner Type
Purchase Details
Closed on
Apr 30, 2025
Sold by
Hernandez Francisco Bernardo
Bought by
Jaramillo Lizett Hernandez
Current Estimated Value
Purchase Details
Closed on
Apr 10, 2013
Sold by
Sinh Mai Viet and Toa Mai Thi
Bought by
Hernandez Francisco B
Home Financials for this Owner
Home Financials are based on the most recent Mortgage that was taken out on this home.
Original Mortgage
$109,479
Interest Rate
4.25%
Mortgage Type
FHA
Purchase Details
Closed on
Nov 7, 2006
Sold by
Mai Augustine and Van Tran Thi
Bought by
Sinh Mai Viet and Toa Mai Thi
Purchase Details
Closed on
Mar 24, 2006
Sold by
Tran Tuan Q and Tran Loan P
Bought by
Mai Augustine and Tran Van T
Purchase Details
Closed on
Jan 29, 2001
Sold by
Beazer Homes Texas Lp
Bought by
Tran Tuan Q
Home Financials for this Owner
Home Financials are based on the most recent Mortgage that was taken out on this home.
Original Mortgage
$31,950
Interest Rate
7.21%
Create a Home Valuation Report for This Property
The Home Valuation Report is an in-depth analysis detailing your home's value as well as a comparison with similar homes in the area
Home Values in the Area
Average Home Value in this Area
Purchase History
| Date | Buyer | Sale Price | Title Company |
|---|---|---|---|
| Jaramillo Lizett Hernandez | -- | None Listed On Document | |
| Hernandez Francisco B | -- | South Land Title Llc | |
| Sinh Mai Viet | -- | None Available | |
| Mai Augustine | -- | None Available | |
| Tran Tuan Q | -- | Texas Lone Star Title Lp |
Source: Public Records
Mortgage History
| Date | Status | Borrower | Loan Amount |
|---|---|---|---|
| Previous Owner | Hernandez Francisco B | $109,479 | |
| Previous Owner | Tran Tuan Q | $31,950 |
Source: Public Records
Tax History Compared to Growth
Tax History
| Year | Tax Paid | Tax Assessment Tax Assessment Total Assessment is a certain percentage of the fair market value that is determined by local assessors to be the total taxable value of land and additions on the property. | Land | Improvement |
|---|---|---|---|---|
| 2025 | $3,485 | $241,675 | $31,500 | $210,175 |
| 2024 | $3,485 | $233,776 | $31,500 | $202,276 |
| 2023 | $3,485 | $251,534 | $31,500 | $220,034 |
| 2022 | $4,787 | $217,220 | $31,500 | $185,720 |
| 2021 | $4,610 | $190,371 | $31,500 | $158,871 |
| 2020 | $4,580 | $166,420 | $28,560 | $137,860 |
| 2019 | $4,437 | $163,878 | $28,560 | $135,318 |
| 2018 | $1,619 | $141,000 | $21,000 | $120,000 |
| 2017 | $4,001 | $141,000 | $21,000 | $120,000 |
| 2016 | $3,637 | $127,075 | $16,800 | $110,275 |
| 2015 | $2,860 | $116,770 | $13,650 | $103,120 |
| 2014 | $2,860 | $102,836 | $10,500 | $92,336 |
Source: Public Records
Map
Nearby Homes
- 1130 Fairlane Square
- 1034 Littleport Ln
- 1123 Maclesby Ln
- 910 Calm Creek Ct
- 1315 Goswell Ln
- 1330 Stevenage Ln
- 830 Stonyridge St
- 15225 Woodforest Blvd
- 15122 Sheffield Terrace
- 826 Ivy Hollow St
- 909 Pennygent Ln
- 814 Deercrest St
- 15418 Cielo Azul Ln
- 1102 Heathfield Dr
- 15418 Lost Lariat Ct
- 730 Stonyridge St
- 1343 Littleport Ln
- 1231 Nuevo Carrasco Ln
- 827 Dondell St
- 15262 Mincing Ln
- 1029 Deerpass Dr
- 1033 Deerpass Dr
- 1027 Deerpass Dr
- 1035 Deerpass Dr
- 1034 Ambrosden Ln
- 1030 Ambrosden Ln
- 1025 Deerpass Dr
- 1037 Deerpass Dr
- 1023 Deerpass Dr
- 15229 Tayport Ln
- 1039 Deerpass Dr
- 1038 Ambrosden Ln
- 1021 Deerpass Dr
- 15227 Tayport Ln
- 1041 Deerpass Dr
- 1035 Ambrosden Ln
- 15231 Tayport Ln
- 1042 Ambrosden Ln
- 1043 Deerpass Dr
- 1046 Ambrosden Ln