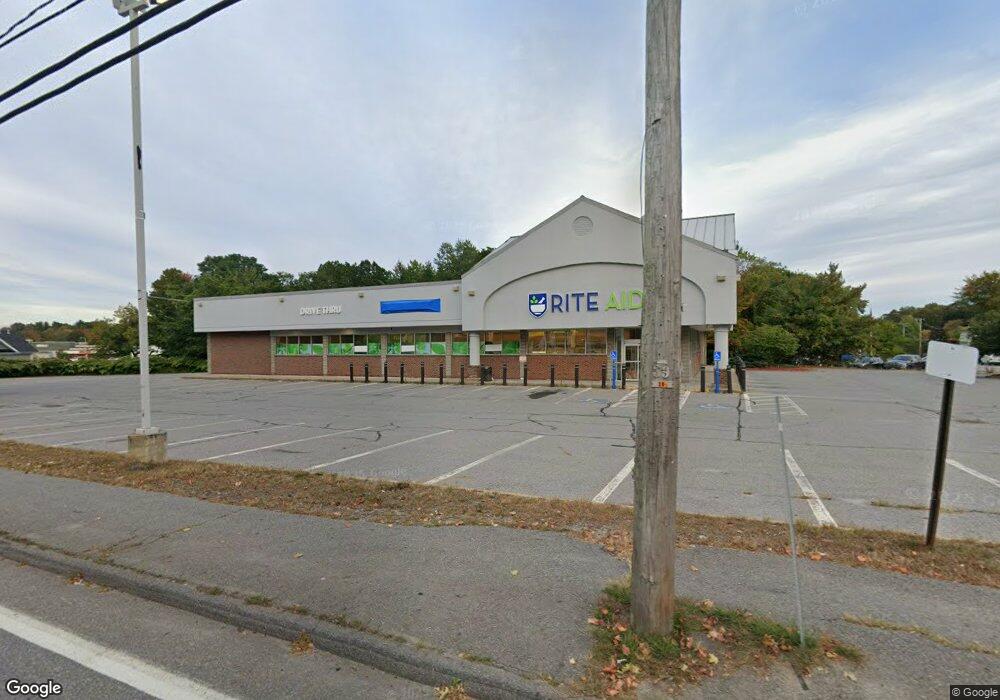
1031 Main St Clinton, MA 01510
Estimated Value: $4,099,502
--
Bed
--
Bath
10,000
Sq Ft
$410/Sq Ft
Est. Value
About This Home
This home is located at 1031 Main St, Clinton, MA 01510 and is currently estimated at $4,099,502, approximately $409 per square foot. 1031 Main St is a home located in Worcester County with nearby schools including Clinton Elementary School, Clinton Senior High School, and Clinton Middle School.
Ownership History
Date
Name
Owned For
Owner Type
Purchase Details
Closed on
Apr 28, 2022
Sold by
1031 Main St Llc
Bought by
Moreland Arizona Prop Llc
Current Estimated Value
Purchase Details
Closed on
Dec 13, 2021
Sold by
Pjc Realty Ma Inc
Bought by
1031 Main St Llc
Home Financials for this Owner
Home Financials are based on the most recent Mortgage that was taken out on this home.
Original Mortgage
$9,700,000
Interest Rate
3.09%
Mortgage Type
Purchase Money Mortgage
Create a Home Valuation Report for This Property
The Home Valuation Report is an in-depth analysis detailing your home's value as well as a comparison with similar homes in the area
Home Values in the Area
Average Home Value in this Area
Purchase History
| Date | Buyer | Sale Price | Title Company |
|---|---|---|---|
| Moreland Arizona Prop Llc | $3,600,000 | None Available | |
| 1031 Main St Llc | $3,125,000 | None Available |
Source: Public Records
Mortgage History
| Date | Status | Borrower | Loan Amount |
|---|---|---|---|
| Previous Owner | 1031 Main St Llc | $9,700,000 |
Source: Public Records
Tax History Compared to Growth
Tax History
| Year | Tax Paid | Tax Assessment Tax Assessment Total Assessment is a certain percentage of the fair market value that is determined by local assessors to be the total taxable value of land and additions on the property. | Land | Improvement |
|---|---|---|---|---|
| 2025 | $61,539 | $2,793,400 | $497,100 | $2,296,300 |
| 2024 | $60,924 | $2,793,400 | $497,100 | $2,296,300 |
| 2023 | $58,258 | $2,598,500 | $496,300 | $2,102,200 |
| 2022 | $50,027 | $1,996,300 | $451,600 | $1,544,700 |
| 2021 | $54,100 | $1,996,300 | $451,600 | $1,544,700 |
| 2020 | $53,601 | $1,996,300 | $451,600 | $1,544,700 |
| 2019 | $52,342 | $1,856,100 | $418,100 | $1,438,000 |
| 2018 | $56,310 | $1,832,400 | $379,900 | $1,452,500 |
| 2017 | $58,903 | $1,843,600 | $379,900 | $1,463,700 |
| 2016 | $57,016 | $1,812,900 | $379,900 | $1,433,000 |
| 2015 | $55,695 | $1,782,800 | $831,000 | $951,800 |
| 2014 | $53,823 | $1,782,800 | $831,000 | $951,800 |
Source: Public Records
Map
Nearby Homes
- 201-203 Stone St
- 201 Stone St Unit 203
- 0 Parker Rd
- 22 Forest Ave
- 1 Grady St
- 136 Mill St
- 92 Mill St
- 57 Clark St
- 23 Bennett Ln
- 29 Bennett Ln
- 132 Kilbourn Rd
- 30 John F. Kennedy Ave
- 19 Magnolia Ave
- 55 Sterling St Unit 306
- 55 Sterling St Unit 314
- 55 Sterling St Unit 212
- 216 Walnut St
- 453 Blue Heron Dr Unit 453
- 12 Woodruff Rd
- 85 Prescott St