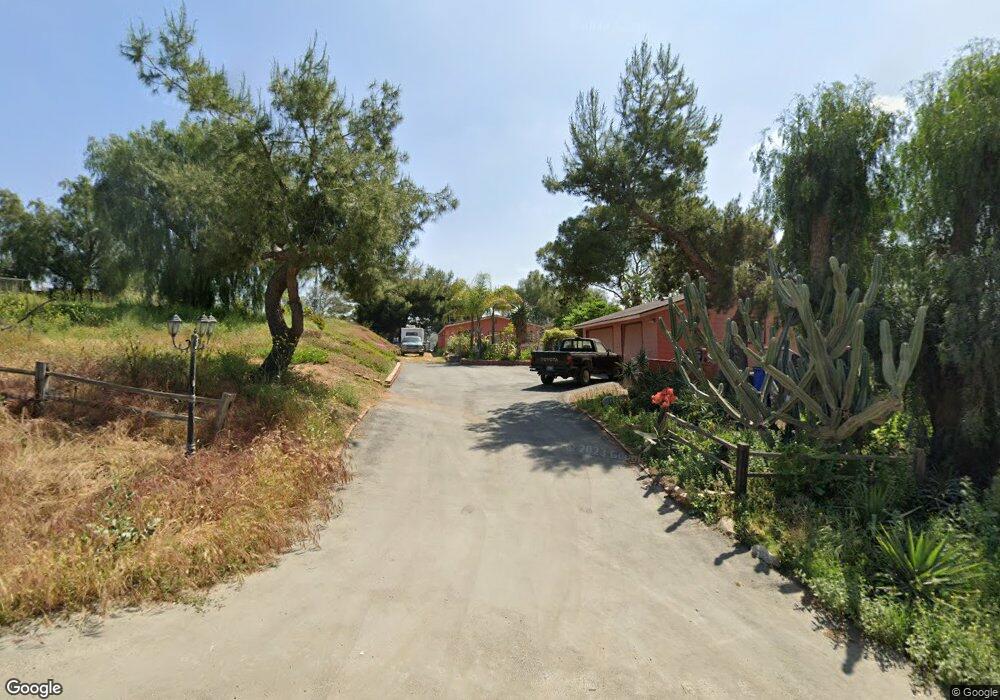
1031 Maple St Ramona, CA 92065
Estimated Value: $750,000 - $924,000
4
Beds
1
Bath
1,740
Sq Ft
$481/Sq Ft
Est. Value
About This Home
This home is located at 1031 Maple St, Ramona, CA 92065 and is currently estimated at $836,611, approximately $480 per square foot. 1031 Maple St is a home located in San Diego County with nearby schools including Hanson Elementary School, Olive Peirce Middle School, and Ramona High School.
Ownership History
Date
Name
Owned For
Owner Type
Purchase Details
Closed on
Oct 21, 2021
Sold by
Wright Donald and Wright Victoria J
Bought by
Wright Donald Ross and Wright Victoria Jo
Current Estimated Value
Purchase Details
Closed on
Jan 28, 1997
Sold by
Hagan Warren R and Hagan Judith M
Bought by
Wright Donald and Wright Victoria J
Home Financials for this Owner
Home Financials are based on the most recent Mortgage that was taken out on this home.
Original Mortgage
$130,000
Outstanding Balance
$15,082
Interest Rate
7.85%
Mortgage Type
Seller Take Back
Estimated Equity
$821,529
Create a Home Valuation Report for This Property
The Home Valuation Report is an in-depth analysis detailing your home's value as well as a comparison with similar homes in the area
Home Values in the Area
Average Home Value in this Area
Purchase History
| Date | Buyer | Sale Price | Title Company |
|---|---|---|---|
| Wright Donald Ross | -- | None Available | |
| Wright Donald | $160,000 | Fidelity National Title |
Source: Public Records
Mortgage History
| Date | Status | Borrower | Loan Amount |
|---|---|---|---|
| Open | Wright Donald | $130,000 |
Source: Public Records
Tax History
| Year | Tax Paid | Tax Assessment Tax Assessment Total Assessment is a certain percentage of the fair market value that is determined by local assessors to be the total taxable value of land and additions on the property. | Land | Improvement |
|---|---|---|---|---|
| 2025 | $2,912 | $260,560 | $138,427 | $122,133 |
| 2024 | $2,912 | $255,452 | $135,713 | $119,739 |
| 2023 | $2,665 | $250,444 | $133,052 | $117,392 |
| 2022 | $2,813 | $245,535 | $130,444 | $115,091 |
| 2021 | $2,765 | $240,722 | $127,887 | $112,835 |
| 2020 | $2,738 | $238,255 | $126,576 | $111,679 |
| 2019 | $2,674 | $233,585 | $124,095 | $109,490 |
| 2018 | $2,606 | $229,006 | $121,662 | $107,344 |
| 2017 | $650 | $224,517 | $119,277 | $105,240 |
| 2016 | $2,508 | $220,116 | $116,939 | $103,177 |
| 2015 | $2,474 | $216,811 | $115,183 | $101,628 |
| 2014 | $2,421 | $212,565 | $112,927 | $99,638 |
Source: Public Records
Map
Nearby Homes
Your Personal Tour Guide
Ask me questions while you tour the home.