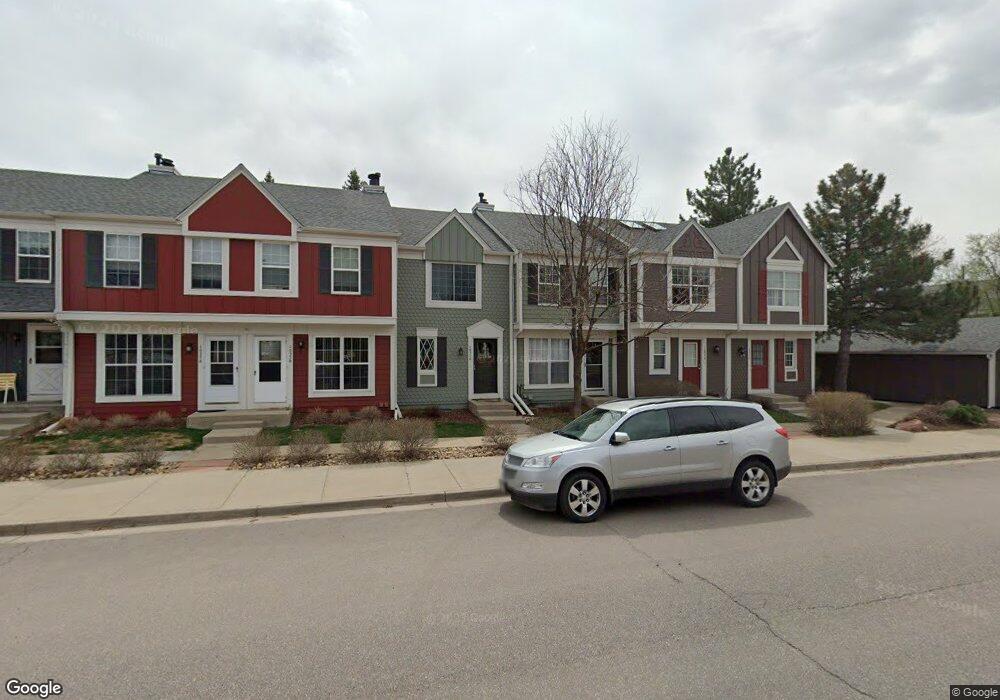
1031 Milo Cir Unit A Lafayette, CO 80026
Estimated Value: $372,000 - $399,000
3
Beds
2
Baths
1,540
Sq Ft
$249/Sq Ft
Est. Value
About This Home
This home is located at 1031 Milo Cir Unit A, Lafayette, CO 80026 and is currently estimated at $383,992, approximately $249 per square foot. 1031 Milo Cir Unit A is a home located in Boulder County with nearby schools including Ryan Elementary School, Angevine Middle School, and Centaurus High School.
Ownership History
Date
Name
Owned For
Owner Type
Purchase Details
Closed on
Aug 17, 2016
Sold by
Chesnutt James Pual
Bought by
Leblane Stephanie
Current Estimated Value
Home Financials for this Owner
Home Financials are based on the most recent Mortgage that was taken out on this home.
Original Mortgage
$235,800
Outstanding Balance
$187,959
Interest Rate
3.45%
Mortgage Type
New Conventional
Estimated Equity
$196,033
Purchase Details
Closed on
Nov 30, 1993
Sold by
Page Jean E and Corbin Rene S
Bought by
Chesnutt James Paul
Purchase Details
Closed on
Apr 12, 1989
Bought by
Leblanc Stephanie
Purchase Details
Closed on
Aug 30, 1988
Bought by
Leblanc Stephanie
Purchase Details
Closed on
Oct 24, 1984
Bought by
Leblanc Stephanie
Create a Home Valuation Report for This Property
The Home Valuation Report is an in-depth analysis detailing your home's value as well as a comparison with similar homes in the area
Home Values in the Area
Average Home Value in this Area
Purchase History
| Date | Buyer | Sale Price | Title Company |
|---|---|---|---|
| Leblane Stephanie | $262,000 | Chicago Title | |
| Chesnutt James Paul | $83,900 | Land Title | |
| Leblanc Stephanie | -- | -- | |
| Leblanc Stephanie | -- | -- | |
| Leblanc Stephanie | $65,600 | -- |
Source: Public Records
Mortgage History
| Date | Status | Borrower | Loan Amount |
|---|---|---|---|
| Open | Leblane Stephanie | $235,800 |
Source: Public Records
Tax History
| Year | Tax Paid | Tax Assessment Tax Assessment Total Assessment is a certain percentage of the fair market value that is determined by local assessors to be the total taxable value of land and additions on the property. | Land | Improvement |
|---|---|---|---|---|
| 2025 | $1,947 | $25,200 | $5,600 | $19,600 |
| 2024 | $1,947 | $25,200 | $5,600 | $19,600 |
| 2023 | $1,913 | $21,969 | $5,601 | $20,053 |
| 2022 | $1,945 | $20,711 | $4,372 | $16,339 |
| 2021 | $1,924 | $21,307 | $4,497 | $16,810 |
| 2020 | $1,894 | $20,721 | $3,790 | $16,931 |
| 2019 | $1,868 | $20,721 | $3,790 | $16,931 |
| 2018 | $1,613 | $17,669 | $3,600 | $14,069 |
| 2017 | $1,571 | $19,534 | $3,980 | $15,554 |
| 2016 | $1,154 | $12,569 | $2,866 | $9,703 |
| 2015 | $1,081 | $10,627 | $2,786 | $7,841 |
| 2014 | $960 | $10,627 | $2,786 | $7,841 |
Source: Public Records
Map
Nearby Homes
- 1045 Milo Cir Unit A
- 1001 Milo Cir Unit B
- 1081 Milo Cir Unit B
- 1068 Milo Cir Unit A
- 1048 Milo Cir Unit A
- 1198 Milo Cir Unit A
- 1266 Milo Cir Unit B
- 920 Milo Cir Unit A
- 1302 Marigold Ct
- 870 Pan Ct
- 1053 Delta Dr Unit B
- 1038 Delta Dr Unit D
- 1080 Artemis Cir
- 865 Sparta Dr
- 815 Argos Cir
- 746 Julian Cir Unit 746
- 1115 Bacchus Dr Unit E
- 718 Julian Cir
- 1006 Sunburst Ct
- 1150 Bacchus Dr Unit 19-A
- 1031 Milo Cir Unit B
- 1025 Milo Cir Unit A
- 1025 Milo Cir Unit B
- 1035 Milo Cir Unit A
- 1021 Milo Cir Unit A
- 1021 Milo Cir Unit B
- 1041 Milo Cir Unit A
- 1041 Milo Cir Unit B
- 1011 Milo Cir Unit A
- 1011 Milo Cir Unit B
- 1045 Milo Cir Unit B
- 1045 Milo Cir
- 1051 Milo Cir Unit A
- 1051 Milo Cir Unit B
- 1001 Milo Cir Unit A
- 1001 Milo Cir
- 1055 Milo Cir Unit B
- 1251 Mercury Dr
- 1071 Milo Cir Unit A
- 1071 Milo Cir Unit B
Your Personal Tour Guide
Ask me questions while you tour the home.