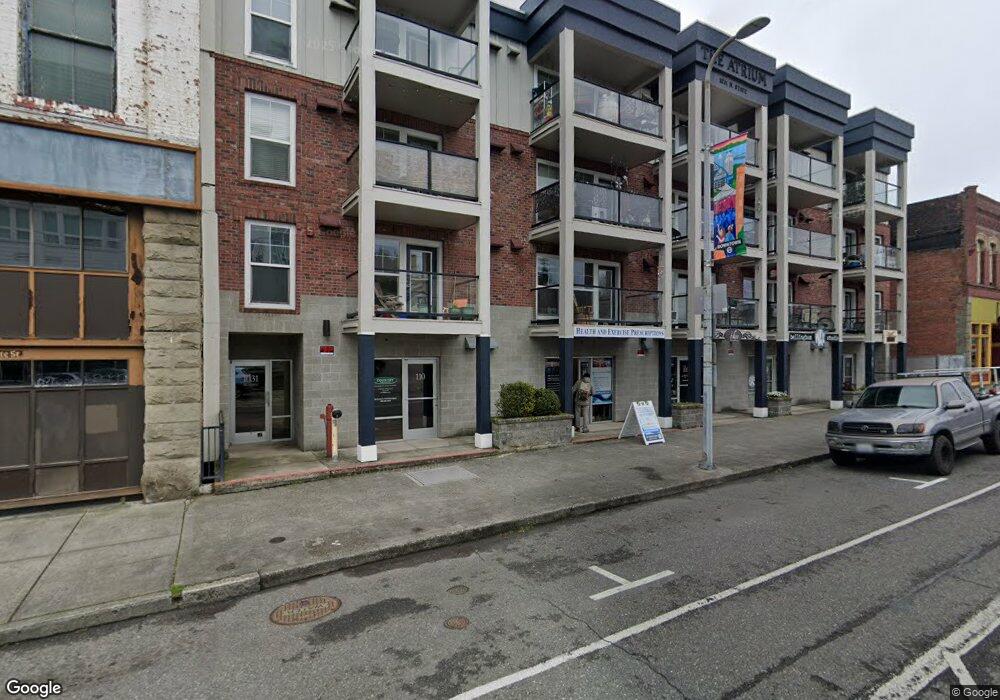
1031 N State St Unit 102 Bellingham, WA 98225
City Center NeighborhoodEstimated Value: $221,446
--
Bed
1
Bath
567
Sq Ft
$391/Sq Ft
Est. Value
About This Home
This home is located at 1031 N State St Unit 102, Bellingham, WA 98225 and is currently estimated at $221,446, approximately $390 per square foot. 1031 N State St Unit 102 is a home located in Whatcom County with nearby schools including Parkview Elementary School, Whatcom Middle School, and Bellingham High School.
Ownership History
Date
Name
Owned For
Owner Type
Purchase Details
Closed on
Mar 15, 2019
Sold by
Phillips Paul B and Phillips Galyna
Bought by
Kocher Manjit and Kocher Parminder
Current Estimated Value
Purchase Details
Closed on
Nov 30, 2017
Sold by
Kruithof Johannes A
Bought by
Philips Paul B and Philips Galyna
Purchase Details
Closed on
Apr 15, 2016
Sold by
Lee Harry Jay and Lee Benjamin C
Bought by
Kruithof Johannes A
Home Financials for this Owner
Home Financials are based on the most recent Mortgage that was taken out on this home.
Original Mortgage
$90,000
Interest Rate
3.73%
Mortgage Type
Commercial
Purchase Details
Closed on
Feb 16, 2010
Sold by
Lee Joanne C
Bought by
Lee Harry Jay
Create a Home Valuation Report for This Property
The Home Valuation Report is an in-depth analysis detailing your home's value as well as a comparison with similar homes in the area
Home Values in the Area
Average Home Value in this Area
Purchase History
| Date | Buyer | Sale Price | Title Company |
|---|---|---|---|
| Kocher Manjit | $132,000 | Chicago Title Insurance | |
| Philips Paul B | -- | Chicago Title | |
| Kruithof Johannes A | $121,000 | Chicago Title Insurance | |
| Lee Harry Jay | -- | Stewart Title Company | |
| Lee Harry Jay | $52,280 | Stewart Title Company |
Source: Public Records
Mortgage History
| Date | Status | Borrower | Loan Amount |
|---|---|---|---|
| Previous Owner | Kruithof Johannes A | $90,000 |
Source: Public Records
Tax History Compared to Growth
Tax History
| Year | Tax Paid | Tax Assessment Tax Assessment Total Assessment is a certain percentage of the fair market value that is determined by local assessors to be the total taxable value of land and additions on the property. | Land | Improvement |
|---|---|---|---|---|
| 2024 | $1,225 | $156,961 | $50,616 | $106,345 |
| 2023 | $1,225 | $156,961 | $50,616 | $106,345 |
| 2022 | $1,152 | $141,407 | $45,600 | $95,807 |
| 2021 | $1,221 | $124,041 | $40,000 | $84,041 |
| 2020 | $1,277 | $124,041 | $40,000 | $84,041 |
| 2019 | $1,183 | $125,417 | $22,480 | $102,937 |
| 2018 | $1,257 | $116,491 | $20,880 | $95,611 |
| 2017 | $1,106 | $105,796 | $22,380 | $83,416 |
| 2016 | $1,062 | $97,287 | $20,580 | $76,707 |
| 2015 | $1,067 | $97,287 | $20,580 | $76,707 |
| 2014 | -- | $94,545 | $20,000 | $74,545 |
| 2013 | -- | $112,308 | $19,600 | $92,708 |
Source: Public Records
Map
Nearby Homes
- 1031 N State St Unit 107
- 1031 N State St Unit 209
- 1001 N State St Unit 403
- 1015 Railroad Ave Unit 418
- 1126 N Forest St
- 901 N Forest St Unit 107
- 901 N Forest St Unit 125
- 901 N Forest St Unit 109
- 310 E Ivy St
- 615 E Myrtle St
- 616 E Myrtle St
- 1025 Granary Ave Unit 503
- 1025 Granary Ave Unit 404
- 1025 Granary Ave Unit 306
- 1025 Granary Ave Unit 506
- 1025 Granary Ave Unit 501-A
- 1025 Granary Ave Unit 307-B
- 1025 Granary Ave Unit 408
- 1025 Granary Ave Unit 407
- 1025 Granary Ave Unit 505
- 1031 N State St Unit 110
- 1031 N State St Unit 108
- 1031 N State St Unit 106
- 1031 N State St Unit 104
- 1031 N State St
- 1031 N State St
- 1031 N State St Unit 409
- 1031 N State St Unit 408
- 1031 N State St Unit 407
- 1031 N State St Unit 406
- 1031 N State St Unit 405
- 1031 N State St Unit 404
- 1031 N State St Unit 403
- 1031 N State St Unit 401
- 1031 N State St Unit 310
- 1031 N State St Unit 309
- 1031 N State St Unit 308
- 1031 N State St Unit 307
- 1031 N State St Unit 306
- 1031 N State St Unit 305