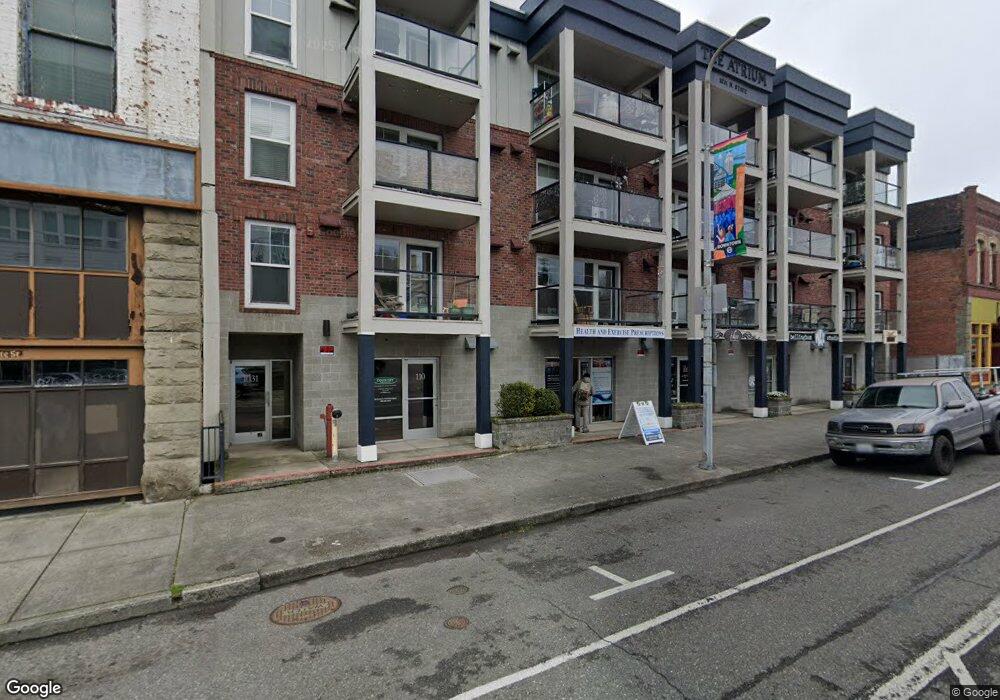
1031 N State St Unit 401 Bellingham, WA 98225
City Center NeighborhoodEstimated Value: $361,019 - $388,000
2
Beds
1
Bath
952
Sq Ft
$392/Sq Ft
Est. Value
About This Home
This home is located at 1031 N State St Unit 401, Bellingham, WA 98225 and is currently estimated at $373,255, approximately $392 per square foot. 1031 N State St Unit 401 is a home located in Whatcom County with nearby schools including Parkview Elementary School, Whatcom Middle School, and Bellingham High School.
Ownership History
Date
Name
Owned For
Owner Type
Purchase Details
Closed on
Aug 18, 2010
Sold by
Hallanger Michael R
Bought by
Hallanger Sharron H
Current Estimated Value
Purchase Details
Closed on
Jun 26, 2008
Sold by
Immanuel Llc
Bought by
Hallanger Michael R and Hallanger Sharron H
Create a Home Valuation Report for This Property
The Home Valuation Report is an in-depth analysis detailing your home's value as well as a comparison with similar homes in the area
Home Values in the Area
Average Home Value in this Area
Purchase History
| Date | Buyer | Sale Price | Title Company |
|---|---|---|---|
| Hallanger Sharron H | -- | None Available | |
| Hallanger Michael R | $197,180 | Stewart Title Company |
Source: Public Records
Tax History Compared to Growth
Tax History
| Year | Tax Paid | Tax Assessment Tax Assessment Total Assessment is a certain percentage of the fair market value that is determined by local assessors to be the total taxable value of land and additions on the property. | Land | Improvement |
|---|---|---|---|---|
| 2024 | $2,975 | $382,016 | $52,640 | $329,376 |
| 2023 | $2,975 | $382,016 | $52,640 | $329,376 |
| 2022 | $2,595 | $315,722 | $43,505 | $272,217 |
| 2021 | $2,500 | $279,400 | $38,500 | $240,900 |
| 2020 | $2,284 | $254,000 | $35,000 | $219,000 |
| 2019 | $1,883 | $224,304 | $32,274 | $192,030 |
| 2018 | $1,862 | $185,454 | $26,684 | $158,770 |
| 2017 | $1,409 | $156,726 | $25,270 | $131,456 |
| 2016 | $218 | $124,000 | $20,000 | $104,000 |
| 2015 | $226 | $20,000 | $20,000 | $0 |
| 2014 | -- | $20,000 | $20,000 | $0 |
| 2013 | -- | $20,000 | $20,000 | $0 |
Source: Public Records
Map
Nearby Homes
- 1031 N State St Unit 107
- 1031 N State St Unit 209
- 1001 N State St Unit 403
- 1015 Railroad Ave Unit 418
- 1126 N Forest St
- 901 N Forest St Unit 107
- 901 N Forest St Unit 125
- 901 N Forest St Unit 109
- 310 E Ivy St
- 615 E Myrtle St
- 616 E Myrtle St
- 1025 Granary Ave Unit 503
- 1025 Granary Ave Unit 404
- 1025 Granary Ave Unit 306
- 1025 Granary Ave Unit 506
- 1025 Granary Ave Unit 501-A
- 1025 Granary Ave Unit 307-B
- 1025 Granary Ave Unit 408
- 1025 Granary Ave Unit 407
- 1025 Granary Ave Unit 505
- 1031 N State St Unit 110
- 1031 N State St Unit 108
- 1031 N State St Unit 106
- 1031 N State St Unit 104
- 1031 N State St Unit 102
- 1031 N State St
- 1031 N State St
- 1031 N State St Unit 409
- 1031 N State St Unit 408
- 1031 N State St Unit 407
- 1031 N State St Unit 406
- 1031 N State St Unit 405
- 1031 N State St Unit 404
- 1031 N State St Unit 403
- 1031 N State St Unit 310
- 1031 N State St Unit 309
- 1031 N State St Unit 308
- 1031 N State St Unit 307
- 1031 N State St Unit 306
- 1031 N State St Unit 305