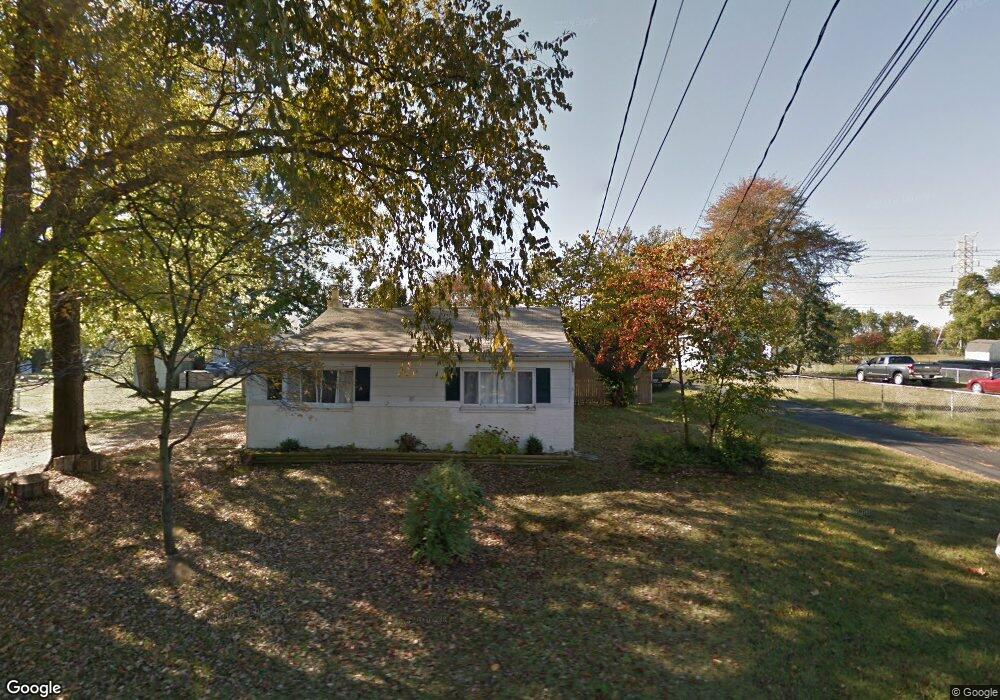
1031 Shoreland Drive A Glen Burnie, MD 21060
Estimated Value: $364,000 - $377,851
--
Bed
2
Baths
720
Sq Ft
$517/Sq Ft
Est. Value
About This Home
This home is located at 1031 Shoreland Drive A, Glen Burnie, MD 21060 and is currently estimated at $371,963, approximately $516 per square foot. 1031 Shoreland Drive A is a home located in Anne Arundel County with nearby schools including Point Pleasant Elementary School, Marley Middle School, and Glen Burnie High School.
Ownership History
Date
Name
Owned For
Owner Type
Purchase Details
Closed on
Jan 31, 2025
Sold by
Ballengee Amanda and Stewart Tyler
Bought by
Zuniga Julio A Ramos and De Ramos Maria
Current Estimated Value
Home Financials for this Owner
Home Financials are based on the most recent Mortgage that was taken out on this home.
Original Mortgage
$353,479
Outstanding Balance
$351,354
Interest Rate
6.85%
Mortgage Type
FHA
Estimated Equity
$20,609
Purchase Details
Closed on
Jul 7, 2023
Sold by
Renfro Katherine A and Simpson Thomas D
Bought by
Ballengee Amanda and Stewart Tyler
Home Financials for this Owner
Home Financials are based on the most recent Mortgage that was taken out on this home.
Original Mortgage
$309,294
Interest Rate
6.79%
Mortgage Type
FHA
Purchase Details
Closed on
Jan 29, 2010
Sold by
Meng Siyi
Bought by
Renfro Katherine A and Simpson Thomas D
Purchase Details
Closed on
Oct 30, 2000
Sold by
Clarke Carole V
Bought by
Heath Steven B
Create a Home Valuation Report for This Property
The Home Valuation Report is an in-depth analysis detailing your home's value as well as a comparison with similar homes in the area
Home Values in the Area
Average Home Value in this Area
Purchase History
| Date | Buyer | Sale Price | Title Company |
|---|---|---|---|
| Zuniga Julio A Ramos | $360,000 | Admiral Title | |
| Zuniga Julio A Ramos | $360,000 | Admiral Title | |
| Ballengee Amanda | $315,000 | Admiral Title | |
| Renfro Katherine A | $223,000 | -- | |
| Heath Steven B | $123,500 | -- |
Source: Public Records
Mortgage History
| Date | Status | Borrower | Loan Amount |
|---|---|---|---|
| Open | Zuniga Julio A Ramos | $353,479 | |
| Closed | Zuniga Julio A Ramos | $353,479 | |
| Previous Owner | Ballengee Amanda | $309,294 | |
| Closed | Heath Steven B | -- |
Source: Public Records
Tax History Compared to Growth
Tax History
| Year | Tax Paid | Tax Assessment Tax Assessment Total Assessment is a certain percentage of the fair market value that is determined by local assessors to be the total taxable value of land and additions on the property. | Land | Improvement |
|---|---|---|---|---|
| 2025 | $3,516 | $295,300 | $180,700 | $114,600 |
| 2024 | $3,516 | $275,233 | $0 | $0 |
| 2023 | $2,792 | $255,167 | $0 | $0 |
| 2022 | $2,590 | $235,100 | $140,000 | $95,100 |
| 2021 | $4,938 | $232,133 | $0 | $0 |
| 2020 | $2,469 | $229,167 | $0 | $0 |
| 2019 | $2,432 | $226,200 | $130,000 | $96,200 |
| 2018 | $2,191 | $216,033 | $0 | $0 |
| 2017 | $2,284 | $205,867 | $0 | $0 |
| 2016 | -- | $195,700 | $0 | $0 |
| 2015 | -- | $187,167 | $0 | $0 |
| 2014 | -- | $178,633 | $0 | $0 |
Source: Public Records
Map
Nearby Homes
- 1531 Furnace Ave
- 1319 Meadowvale Rd
- 352 Gatewater Ct Unit A
- 1125 Wynbrook Rd
- 906 Silver Maple Ct
- 907 Princeton Terrace
- 1017 4th St
- 7195 Wolf Trap Ct
- Caroline Plan at Tanyard Shores - 55+ Villas
- 1011 4th St
- 900 Princeton Terrace
- 7805 Leymar Rd
- 110 Northdale Rd
- 1026 Twin View
- 7205 Sprouse Ct
- 7508 Blue Sun Dr
- 136 Margate Dr
- 146 Midland Rd
- 7664 Quartzite Ln
- 210 Hollywood Ct
- 1031 Shoreland Dr
- 1033 Shoreland Dr
- 1035 Shoreland Dr
- 1039 Shoreland Dr
- 1027 Shoreland Dr
- 1037 Shoreland Dr
- 1034 Shoreland Dr
- 1030 Shoreland Dr
- 1025A Shoreland Dr
- 1025 Shoreland Dr
- 1028 Shoreland Dr
- 1041 Shoreland Dr
- 1032 Shoreland Dr
- 1514 Furnace Ave
- 1023A Shoreland Dr
- 1023 Shoreland Dr
- 1023 Shoreland Dr
- 1504 Furnace Ave
- 0 Furnace Ave Unit 1006620516
- 0 Furnace Ave Unit AA7195818