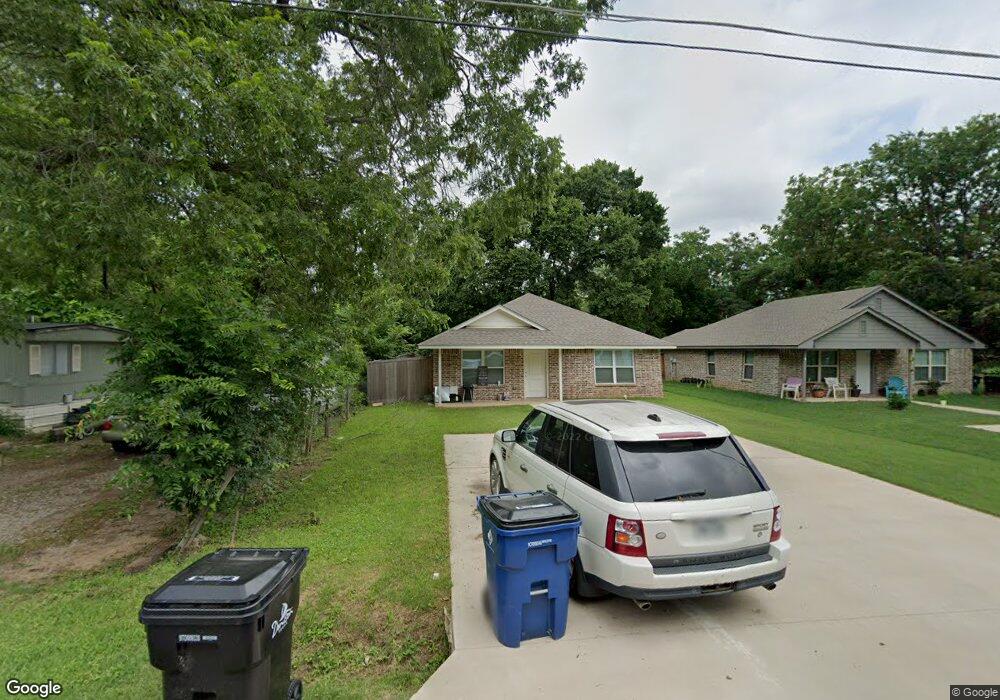
1031 W Ford St Denison, TX 75020
Estimated Value: $209,000
3
Beds
2
Baths
1,242
Sq Ft
$168/Sq Ft
Est. Value
About This Home
This home is located at 1031 W Ford St, Denison, TX 75020 and is currently estimated at $209,000, approximately $168 per square foot. 1031 W Ford St is a home located in Grayson County with nearby schools including Scott Middle School, Denison High School, and St. Luke's Parish Day School.
Ownership History
Date
Name
Owned For
Owner Type
Purchase Details
Closed on
Aug 31, 2020
Sold by
Genuine Homes Llc
Bought by
Aleman Vanessa N
Current Estimated Value
Home Financials for this Owner
Home Financials are based on the most recent Mortgage that was taken out on this home.
Original Mortgage
$157,542
Outstanding Balance
$139,808
Interest Rate
2.9%
Mortgage Type
Stand Alone Second
Estimated Equity
$69,192
Purchase Details
Closed on
Dec 18, 2018
Sold by
Stone Castle Investors Llc
Bought by
Genuine Homes Llc
Home Financials for this Owner
Home Financials are based on the most recent Mortgage that was taken out on this home.
Original Mortgage
$11,000
Interest Rate
4.8%
Mortgage Type
New Conventional
Purchase Details
Closed on
Nov 29, 2018
Sold by
Hodge Gregg
Bought by
Stone Castke Investors Llc
Home Financials for this Owner
Home Financials are based on the most recent Mortgage that was taken out on this home.
Original Mortgage
$11,000
Interest Rate
4.8%
Mortgage Type
New Conventional
Create a Home Valuation Report for This Property
The Home Valuation Report is an in-depth analysis detailing your home's value as well as a comparison with similar homes in the area
Home Values in the Area
Average Home Value in this Area
Purchase History
| Date | Buyer | Sale Price | Title Company |
|---|---|---|---|
| Aleman Vanessa N | -- | Red River Title Co | |
| Genuine Homes Llc | -- | Red River Title Co | |
| Stone Castke Investors Llc | -- | None Available | |
| Hodge Gregg | -- | None Available |
Source: Public Records
Mortgage History
| Date | Status | Borrower | Loan Amount |
|---|---|---|---|
| Open | Aleman Vanessa N | $157,542 | |
| Previous Owner | Stone Castke Investors Llc | $11,000 |
Source: Public Records
Tax History Compared to Growth
Tax History
| Year | Tax Paid | Tax Assessment Tax Assessment Total Assessment is a certain percentage of the fair market value that is determined by local assessors to be the total taxable value of land and additions on the property. | Land | Improvement |
|---|---|---|---|---|
| 2025 | $5,103 | $223,432 | $40,016 | $183,416 |
| 2024 | $5,103 | $219,662 | $36,670 | $182,992 |
| 2023 | $5,149 | $227,261 | $35,293 | $191,968 |
| 2022 | $5,131 | $215,968 | $35,293 | $180,675 |
| 2021 | $4,051 | $160,616 | $13,120 | $147,496 |
| 2020 | $4,150 | $157,333 | $9,840 | $147,493 |
| 2019 | $542 | $19,680 | $19,680 | $0 |
| 2018 | $291 | $10,496 | $10,496 | $0 |
| 2017 | $162 | $5,773 | $5,773 | $0 |
| 2016 | $298 | $12,805 | $5,773 | $7,032 |
| 2015 | $104 | $11,689 | $5,773 | $5,916 |
| 2014 | $92 | $8,803 | $2,887 | $5,916 |
Source: Public Records
Map
Nearby Homes
- 928 W Chase St
- 930 W Florence St
- 904 W Florence St
- 1044 W Ford St
- 1901 Woodlawn Blvd
- 919 W Collins St
- 923 W Collins St
- 921 W Collins St
- 1210 W Bullock St
- 1705 Woodlawn Blvd
- 1830 Clark Dr
- 916 W Collins St
- 1023 W Bullock St
- 527 W Coffin St
- 1016 W Hanna St
- 736 W Bullock St
- 0 S Maurice Ave
- 2560 S Scullin Ave
- 923 Dubois St
- 603 W Star St
- 1025 W Ford St
- 1017 W Ford St
- 1014 W Ford St
- 1026 Chase St
- 1038 Chase St
- 1028 Chase St
- 1038 Chase St
- 1037 W Ford St
- 1022 Chase St
- 1020 W Ford St
- 1018 W Ford St
- 1016 W Ford St
- 1042 W Ford St
- 2131 S College Blvd
- 1006 Chase St
- 1022 W Chase St
- 2201 S College Blvd
- 1018 W Chase St
- 1025 W Florence St
- 1015 W Florence St