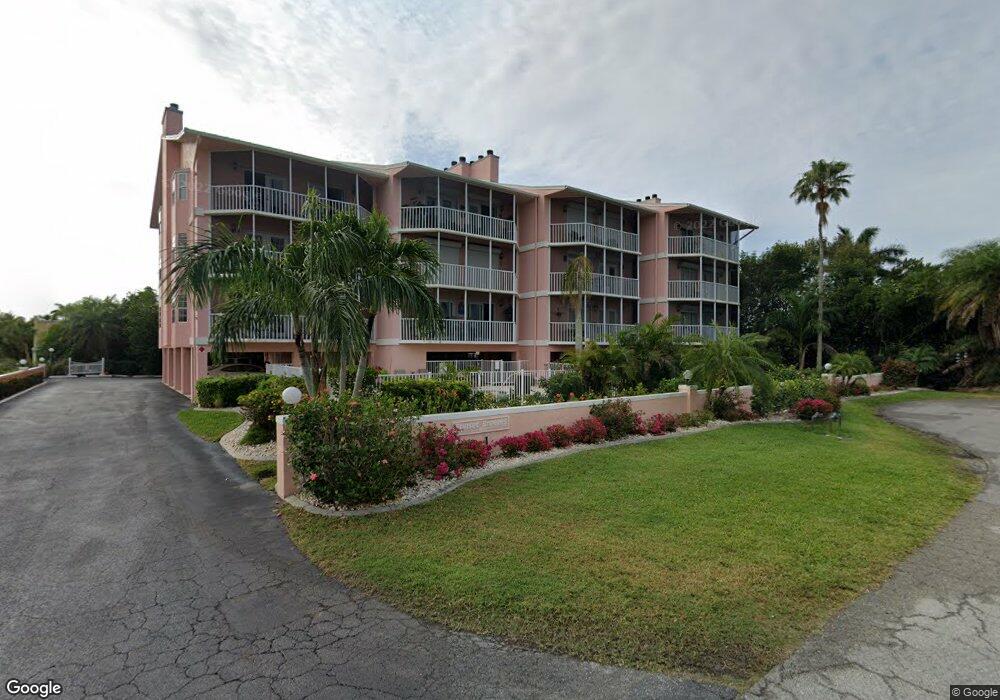
1031 W Retta Esplanade Unit 114 Punta Gorda, FL 33950
Central Punta Gorda NeighborhoodEstimated Value: $339,540 - $344,000
2
Beds
2
Baths
1,404
Sq Ft
$243/Sq Ft
Est. Value
About This Home
This home is located at 1031 W Retta Esplanade Unit 114, Punta Gorda, FL 33950 and is currently estimated at $341,770, approximately $243 per square foot. 1031 W Retta Esplanade Unit 114 is a home located in Charlotte County with nearby schools including Sallie Jones Elementary School, Punta Gorda Middle School, and Charlotte High School.
Ownership History
Date
Name
Owned For
Owner Type
Purchase Details
Closed on
Sep 16, 2016
Sold by
Geroge Betty R
Bought by
Lving George Betty R and Lving Betty R George Revoabler
Current Estimated Value
Purchase Details
Closed on
Mar 13, 2015
Sold by
Carpenter Josephine Benz and Johnson Gary M
Bought by
George Betty R
Home Financials for this Owner
Home Financials are based on the most recent Mortgage that was taken out on this home.
Original Mortgage
$129,600
Interest Rate
3.69%
Mortgage Type
New Conventional
Purchase Details
Closed on
Sep 27, 2010
Sold by
Carpenter Virginia E
Bought by
Carpenter Thomas K and Thomas K Carpenter 1996 Living Trust
Purchase Details
Closed on
Jun 30, 2000
Sold by
Katzmann Helen K
Bought by
Carpenter Virginia E
Purchase Details
Closed on
Dec 1, 1995
Sold by
Hopp William M and Hopp Ruth Ann
Bought by
Katzmann Helen K
Create a Home Valuation Report for This Property
The Home Valuation Report is an in-depth analysis detailing your home's value as well as a comparison with similar homes in the area
Home Values in the Area
Average Home Value in this Area
Purchase History
| Date | Buyer | Sale Price | Title Company |
|---|---|---|---|
| Lving George Betty R | -- | None Available | |
| George Betty R | $162,000 | Florida Title & Guarantee Ag | |
| Carpenter Thomas K | $125,000 | Attorney | |
| Carpenter Virginia E | $140,000 | -- | |
| Katzmann Helen K | $125,000 | -- |
Source: Public Records
Mortgage History
| Date | Status | Borrower | Loan Amount |
|---|---|---|---|
| Previous Owner | George Betty R | $129,600 |
Source: Public Records
Tax History Compared to Growth
Tax History
| Year | Tax Paid | Tax Assessment Tax Assessment Total Assessment is a certain percentage of the fair market value that is determined by local assessors to be the total taxable value of land and additions on the property. | Land | Improvement |
|---|---|---|---|---|
| 2023 | $1,401 | $18,955 | $0 | $0 |
| 2022 | $1,401 | $122,688 | $0 | $0 |
| 2021 | $1,378 | $119,115 | $0 | $0 |
| 2020 | $1,325 | $117,470 | $0 | $0 |
| 2019 | $1,297 | $114,829 | $0 | $0 |
| 2018 | $1,177 | $112,688 | $0 | $0 |
| 2017 | $1,162 | $110,370 | $0 | $0 |
| 2016 | $1,152 | $108,100 | $0 | $0 |
| 2015 | $1,943 | $105,582 | $0 | $0 |
| 2014 | $1,802 | $95,984 | $0 | $0 |
Source: Public Records
Map
Nearby Homes
- 1020 W Marion Ave Unit 42
- 1020 W Marion Ave Unit 50
- 1020 W Marion Ave Unit 41
- 217 Shreve St
- 950 W Olympia Ave
- 1250 W Marion Ave Unit 323
- 1250 W Marion Ave Unit 341
- 1250 W Marion Ave Unit 122
- 1250 W Marion Ave Unit 3UNIT33
- 1250 W Marion Ave Unit 242
- 821 W Marion Ave
- 817 W Marion Ave
- 809 Kings Ct
- 130 Breakers Ct Unit 2UNIT21
- 310 Caicos Dr
- 121 Dolly St
- 717 W Marion Ave
- 706 W Marion Ave
- 257 Chasteen #2 St Unit 2
- 702 W Olympia Ave
- 1031 W Retta Esplanade Unit 111
- 1031 W Retta Esplanade Unit 123
- 1031 W Retta Esplanade Unit 131
- 1031 W Retta Esplanade Unit 121
- 1031 W Retta Esplanade Unit 124
- 1031 W Retta Esplanade Unit 113
- 1031 W Retta Esplanade Unit 132
- 1031 W Retta Esplanade Unit 134
- 1031 W Retta Esplanade Unit 133
- 1031 W Retta Esplanade Unit 122
- 1031 W Retta Esplanade Unit 112
- 1020 W Marion Ave
- 1020 W Marion Ave Unit 55
- 1020 W Marion Ave Unit 53
- 1020 W Marion Ave Unit 46
- 1020 W Marion Ave Unit 45
- 1020 W Marion Ave Unit 44
- 1020 W Marion Ave Unit 54
- 1020 W Marion Ave Unit 52
- 1020 W Marion Ave Unit 51