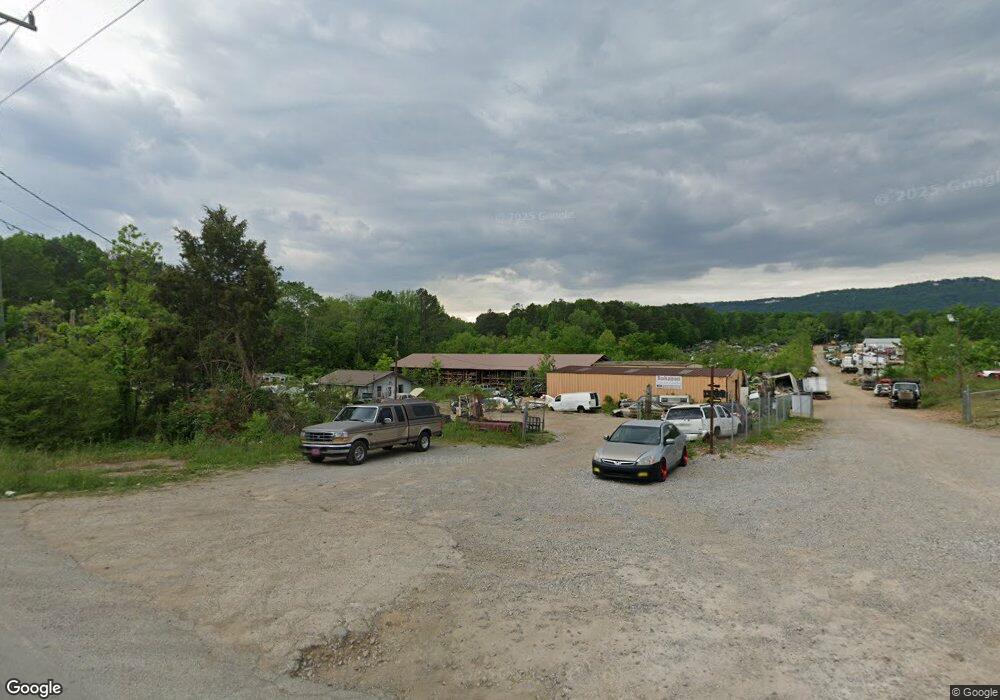
1031 Wilson Rd Rossville, GA 30741
Estimated Value: $170,000
--
Bed
2
Baths
2,400
Sq Ft
$71/Sq Ft
Est. Value
About This Home
This home is located at 1031 Wilson Rd, Rossville, GA 30741 and is currently priced at $170,000, approximately $70 per square foot. 1031 Wilson Rd is a home located in Walker County with nearby schools including Rossville Elementary School, Rossville Middle School, and Ridgeland High School.
Ownership History
Date
Name
Owned For
Owner Type
Purchase Details
Closed on
Mar 11, 2021
Sold by
Lusk Rodney Cecil
Bought by
Strauss Gene and Strauss Angela
Current Estimated Value
Purchase Details
Closed on
Oct 30, 2020
Sold by
Lusk Rachel Marlene
Bought by
Bohanon Randy and Bohanon Sarah
Purchase Details
Closed on
Oct 29, 2020
Sold by
Bohanon Randy
Bought by
Lusk Rachel Marlene and Lusk Rodney Cecil
Purchase Details
Closed on
Apr 22, 2004
Sold by
Lusk Rayburn
Bought by
Bohanon Randy and Bohanon Donald
Purchase Details
Closed on
Mar 8, 1983
Sold by
Wooten Richard L
Bought by
Lusk Rayburn
Purchase Details
Closed on
Oct 19, 1982
Sold by
Crane Crane R and Crane B
Bought by
Wooten Richard L
Purchase Details
Closed on
Jan 1, 1982
Sold by
Wooten Richard L and Wooten Carolyn
Bought by
Crane Crane R and Crane B
Purchase Details
Closed on
Sep 12, 1979
Sold by
Renegar Ross F
Bought by
Wooten Richard L and Wooten Carolyn
Purchase Details
Closed on
Aug 1, 1973
Bought by
Renegar Ross F
Create a Home Valuation Report for This Property
The Home Valuation Report is an in-depth analysis detailing your home's value as well as a comparison with similar homes in the area
Home Values in the Area
Average Home Value in this Area
Purchase History
| Date | Buyer | Sale Price | Title Company |
|---|---|---|---|
| Strauss Gene | $55,000 | -- | |
| Bohanon Randy | -- | -- | |
| Lusk Rachel Marlene | -- | -- | |
| Bohanon Randy | $150,000 | -- | |
| Lusk Rayburn | $75,000 | -- | |
| Wooten Richard L | $60,000 | -- | |
| Crane Crane R | $60,000 | -- | |
| Wooten Richard L | -- | -- | |
| Renegar Ross F | -- | -- |
Source: Public Records
Tax History Compared to Growth
Tax History
| Year | Tax Paid | Tax Assessment Tax Assessment Total Assessment is a certain percentage of the fair market value that is determined by local assessors to be the total taxable value of land and additions on the property. | Land | Improvement |
|---|---|---|---|---|
| 2024 | $2,131 | $80,322 | $50,170 | $30,152 |
| 2023 | $1,527 | $49,579 | $38,592 | $10,987 |
| 2022 | $1,662 | $54,714 | $48,240 | $6,474 |
| 2021 | $1,789 | $53,994 | $48,240 | $5,754 |
| 2020 | $3,057 | $94,840 | $50,820 | $44,020 |
| 2019 | $3,108 | $94,840 | $50,820 | $44,020 |
| 2018 | $2,509 | $94,840 | $50,820 | $44,020 |
| 2017 | $3,367 | $94,840 | $50,820 | $44,020 |
| 2016 | $2,651 | $94,840 | $50,820 | $44,020 |
| 2015 | $1,796 | $56,277 | $16,940 | $39,337 |
| 2014 | $1,585 | $56,277 | $16,940 | $39,337 |
| 2013 | -- | $56,317 | $16,940 | $39,377 |
Source: Public Records
Map
Nearby Homes
- 1014 Wilson Rd
- 53 Charlsie Trail Unit 12
- 635 N Sherry Dr
- 5220 Fagan St
- 5343 Usher Dr
- 715 W James St
- 717 W James St
- 601 James St
- 5342 Slayton Ave
- Lots 7 & 5 Slayton Ave
- 5413 Lee Ave
- 816 Indian Ave
- 0 Slayton Ave Unit 1504633
- 527 W Gordon Ave
- 724 Shelly Ln
- 1014 Lee Ave
- 509 W Gordon Ave
- 610 Union Ave
- 126 S Liner St
- 200 W Oak St