Estimated Value: $231,000 - $262,000
3
Beds
1
Bath
1,176
Sq Ft
$210/Sq Ft
Est. Value
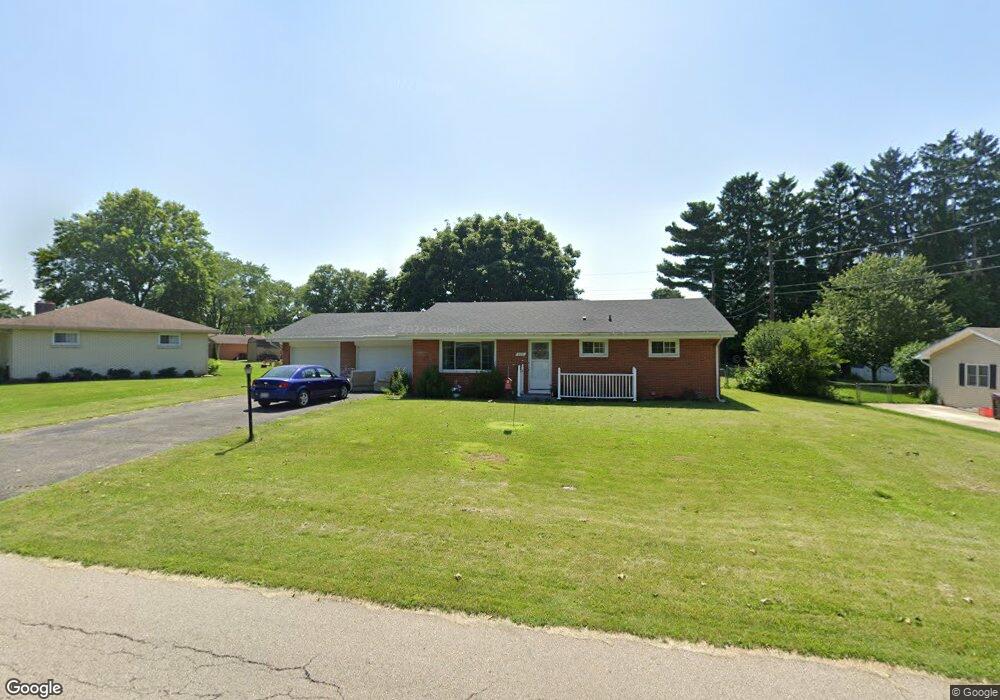
About This Home
This home is located at 1031 Yellowstone Rd, Xenia, OH 45385 and is currently estimated at $247,081, approximately $210 per square foot. 1031 Yellowstone Rd is a home located in Greene County with nearby schools including Xenia High School, Summit Academy Community School for Alternative Learners - Xenia, and Legacy Christian Academy.
Ownership History
Date
Name
Owned For
Owner Type
Purchase Details
Closed on
Jun 15, 2018
Sold by
Caudill Pamela
Bought by
Drew Shana and Drew James S
Current Estimated Value
Home Financials for this Owner
Home Financials are based on the most recent Mortgage that was taken out on this home.
Original Mortgage
$113,600
Outstanding Balance
$98,245
Interest Rate
4.5%
Mortgage Type
New Conventional
Estimated Equity
$148,836
Purchase Details
Closed on
Oct 27, 2006
Sold by
Shaner John R
Bought by
Brownlee Lori R
Home Financials for this Owner
Home Financials are based on the most recent Mortgage that was taken out on this home.
Original Mortgage
$91,600
Interest Rate
6.45%
Mortgage Type
Unknown
Purchase Details
Closed on
Dec 24, 1998
Sold by
Estate Of Mary M Shaner
Bought by
Shaner John R
Create a Home Valuation Report for This Property
The Home Valuation Report is an in-depth analysis detailing your home's value as well as a comparison with similar homes in the area
Home Values in the Area
Average Home Value in this Area
Purchase History
| Date | Buyer | Sale Price | Title Company |
|---|---|---|---|
| Drew Shana | $142,000 | First American Mortgage Solu | |
| Brownlee Lori R | $114,500 | Attorney | |
| Shaner John R | -- | -- |
Source: Public Records
Mortgage History
| Date | Status | Borrower | Loan Amount |
|---|---|---|---|
| Open | Drew Shana | $113,600 | |
| Closed | Brownlee Lori R | $91,600 |
Source: Public Records
Tax History Compared to Growth
Tax History
| Year | Tax Paid | Tax Assessment Tax Assessment Total Assessment is a certain percentage of the fair market value that is determined by local assessors to be the total taxable value of land and additions on the property. | Land | Improvement |
|---|---|---|---|---|
| 2024 | $3,068 | $63,120 | $13,860 | $49,260 |
| 2023 | $3,068 | $63,120 | $13,860 | $49,260 |
| 2022 | $2,542 | $47,400 | $11,550 | $35,850 |
| 2021 | $2,574 | $47,400 | $11,550 | $35,850 |
| 2020 | $2,474 | $47,400 | $11,550 | $35,850 |
| 2019 | $1,946 | $35,000 | $10,100 | $24,900 |
| 2018 | $1,901 | $35,000 | $10,100 | $24,900 |
| 2017 | $1,346 | $35,000 | $10,100 | $24,900 |
| 2016 | $1,346 | $33,130 | $10,100 | $23,030 |
| 2015 | $1,885 | $33,130 | $10,100 | $23,030 |
| 2014 | $1,810 | $33,130 | $10,100 | $23,030 |
Source: Public Records
Map
Nearby Homes
- 15 Sexton Dr
- 965 Oak Dale Dr
- 2018 Tahoe Dr
- 1359 Eagles Way
- 2094 Malibu Trail
- 460 Kinsey Rd
- 1311 Eagles Way
- 2537 Ridge Rd
- 1968 El Camino Dr
- 983 Echo Ct
- 1171 N Detroit St
- 1872 Harris Ln
- 1815 Promenade Ln
- 1038 Frederick Dr
- 493 Hollywood Blvd
- 499 Hollywood Blvd
- 1791 Palmer Ct
- 1820 Palmer Ct
- 1802 Palmer Ct
- 1796 Palmer Ct
- 1041 Yellowstone Rd
- 1021 Yellowstone Rd
- 1032 Trianon Dr
- 1042 Trianon Dr
- 178 Hardacre Dr
- 1026 Trianon Dr
- 1051 Yellowstone Rd
- 1044 Yellowstone Rd
- 184 Hardacre Dr
- 1001 Yellowstone Rd
- 1061 Yellowstone Rd
- 1054 Yellowstone Rd
- 181 Hardacre Dr
- 161 Hardacre Dr
- 1033 Trianon Dr
- 1062 Trianon Dr
- 1045 Trianon Dr
- 194 Hardacre Dr
- 1031 Trianon Dr
- 191 Hardacre Dr