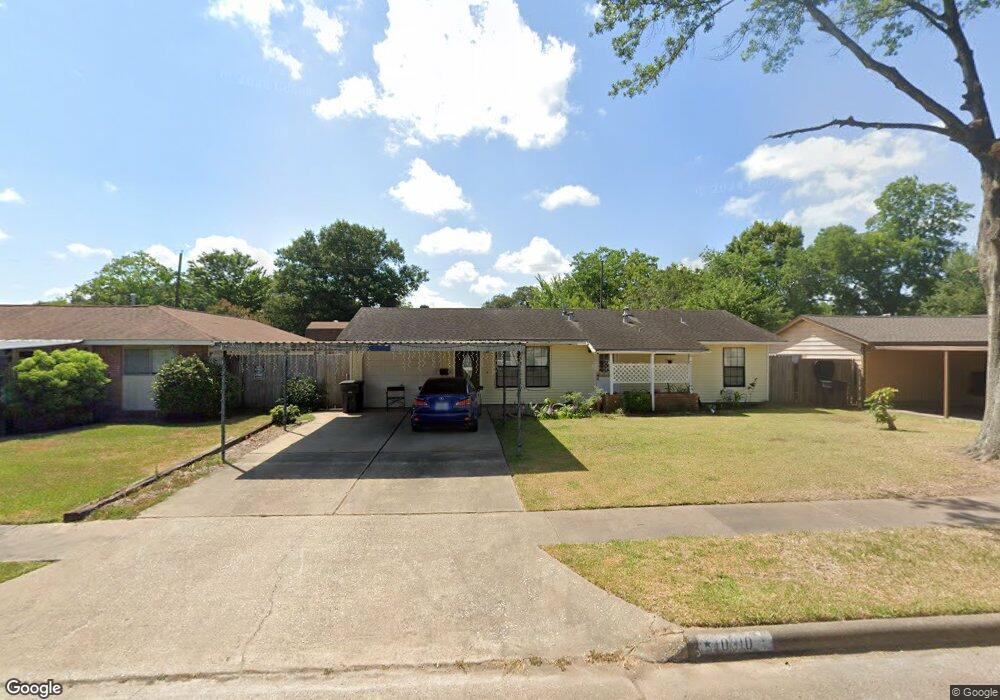
10310 Buena Park Dr Houston, TX 77089
Southbelt-Ellington NeighborhoodEstimated Value: $178,000 - $206,000
3
Beds
1
Bath
900
Sq Ft
$210/Sq Ft
Est. Value
About This Home
This home is located at 10310 Buena Park Dr, Houston, TX 77089 and is currently estimated at $189,010, approximately $210 per square foot. 10310 Buena Park Dr is a home located in Harris County with nearby schools including Meador Elementary School, Morris Middle School, and Beverly Hill Intermediate School.
Ownership History
Date
Name
Owned For
Owner Type
Purchase Details
Closed on
Oct 16, 2012
Sold by
Brown Randy Joseph
Bought by
Cortez Eugenia
Current Estimated Value
Home Financials for this Owner
Home Financials are based on the most recent Mortgage that was taken out on this home.
Original Mortgage
$68,732
Outstanding Balance
$47,841
Interest Rate
3.62%
Mortgage Type
FHA
Estimated Equity
$141,169
Purchase Details
Closed on
Jul 28, 2005
Sold by
Long Robert A and Long Connie L
Bought by
Brown Leona F
Home Financials for this Owner
Home Financials are based on the most recent Mortgage that was taken out on this home.
Original Mortgage
$52,000
Interest Rate
5.61%
Mortgage Type
Fannie Mae Freddie Mac
Purchase Details
Closed on
Mar 30, 1994
Sold by
Long William E
Bought by
Long Robert A and Long Connie L
Create a Home Valuation Report for This Property
The Home Valuation Report is an in-depth analysis detailing your home's value as well as a comparison with similar homes in the area
Home Values in the Area
Average Home Value in this Area
Purchase History
| Date | Buyer | Sale Price | Title Company |
|---|---|---|---|
| Cortez Eugenia | -- | None Available | |
| Brown Leona F | -- | Texas American Title Company | |
| Long Robert A | -- | Regency Title |
Source: Public Records
Mortgage History
| Date | Status | Borrower | Loan Amount |
|---|---|---|---|
| Open | Cortez Eugenia | $68,732 | |
| Previous Owner | Brown Leona F | $52,000 |
Source: Public Records
Tax History Compared to Growth
Tax History
| Year | Tax Paid | Tax Assessment Tax Assessment Total Assessment is a certain percentage of the fair market value that is determined by local assessors to be the total taxable value of land and additions on the property. | Land | Improvement |
|---|---|---|---|---|
| 2025 | $2,141 | $152,431 | $52,511 | $99,920 |
| 2024 | $2,141 | $156,424 | $52,511 | $103,913 |
| 2023 | $2,141 | $156,424 | $52,511 | $103,913 |
| 2022 | $3,397 | $141,647 | $52,511 | $89,136 |
| 2021 | $3,240 | $120,625 | $38,508 | $82,117 |
| 2020 | $3,014 | $117,588 | $38,508 | $79,080 |
| 2019 | $2,881 | $114,196 | $29,756 | $84,440 |
| 2018 | $1,043 | $90,867 | $26,956 | $63,911 |
| 2017 | $2,422 | $90,867 | $26,956 | $63,911 |
| 2016 | $2,202 | $81,547 | $26,956 | $54,591 |
| 2015 | $1,427 | $72,673 | $19,254 | $53,419 |
| 2014 | $1,427 | $67,893 | $19,254 | $48,639 |
Source: Public Records
Map
Nearby Homes
- 10619 Wheaton Dr
- 10214 Buena Park Dr
- 10207 Rambling Trail
- 10442 Southport Dr
- 10211 Glenmawr Dr
- 10815 Ritow St
- 10614 Sabo Rd
- 10823 Overlea Dr
- 10906 Keese Dr
- 10147 Torrington Ln
- 10906 Green Arbor Dr
- 10018 Ramey St
- 11303 Caribbean Ln
- 11311 Caribbean Ln
- 9914 Sumerlin St
- 9743 Santa Monica Blvd
- 9811 Mango St
- 9711 Ebb St
- 9721 Foredale St
- 11433 Sabo Rd
- 10314 Buena Park Dr
- 10311 Rambling Trail
- 10302 Buena Park Dr
- 10318 Buena Park Dr
- 10307 Rambling Trail
- 10315 Rambling Trail
- 10319 Rambling Trail
- 10303 Rambling Trail
- 10311 Buena Park Dr
- 10226 Buena Park Dr
- 10226 Buena Park Dr Unit 1
- 10322 Buena Park Dr
- 10307 Buena Park Dr
- 10315 Buena Park Dr
- 10303 Buena Park Dr
- 10319 Buena Park Dr
- 10219 Rambling Trail
- 10323 Rambling Trail
- 10326 Buena Park Dr
- 10222 Buena Park Dr