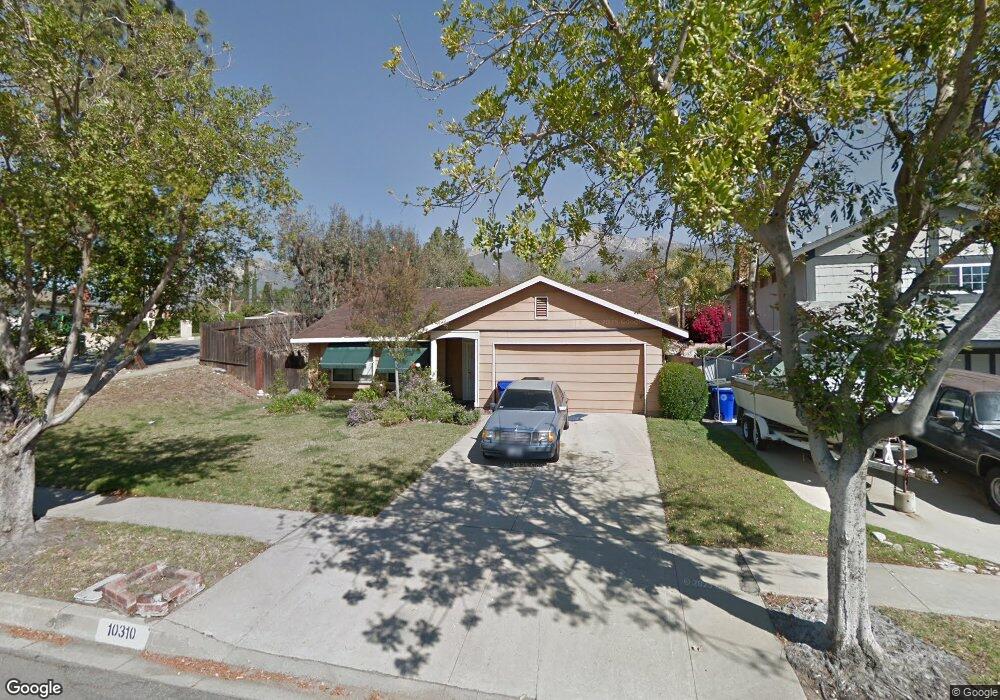
10310 Orange St Rancho Cucamonga, CA 91737
Alta Loma NeighborhoodEstimated Value: $681,980 - $793,000
About This Home
This home is located at 10310 Orange St, Rancho Cucamonga, CA 91737 and is currently estimated at $731,995, approximately $499 per square foot. 10310 Orange St is a home located in San Bernardino County with nearby schools including Deer Canyon Elementary, Vineyard Junior High, and Los Osos High.
Ownership History
We collect this data history from publicly available records. To have your information removed, we recommend requesting removal directly through your county’s website.
Purchase Details
Purchase Details
Purchase Details
Home Financials for this Owner
Home Financials are based on the most recent Mortgage that was taken out on this home.Home Values in the Area
Average Home Value in this Area
Purchase History
We collect this data history from publicly available records. To have your information removed, we recommend requesting removal directly through your county’s website.
| Date | Buyer | Sale Price | Title Company |
|---|---|---|---|
| -- | None Available | ||
| -- | None Available | ||
| $250,000 | Fidelity National Title |
Mortgage History
We collect this data history from publicly available records. To have your information removed, we recommend requesting removal directly through your county’s website.
| Date | Status | Borrower | Loan Amount |
|---|---|---|---|
| Open | $187,500 |
Tax History
We collect this data history from publicly available records. To have your information removed, we recommend requesting removal directly through your county’s website.
| Year | Tax Paid | Tax Assessment Tax Assessment Total Assessment is a certain percentage of the fair market value that is determined by local assessors to be the total taxable value of land and additions on the property. | Land | Improvement |
|---|---|---|---|---|
| 2025 | $4,278 | $375,482 | $113,782 | $261,700 |
| 2024 | $4,173 | $368,120 | $111,551 | $256,569 |
| 2023 | $4,081 | $360,902 | $109,364 | $251,538 |
| 2022 | $4,071 | $353,826 | $107,220 | $246,606 |
| 2021 | $4,070 | $346,889 | $105,118 | $241,771 |
| 2020 | $3,907 | $343,332 | $104,040 | $239,292 |
| 2019 | $3,950 | $336,600 | $102,000 | $234,600 |
| 2018 | $2,374 | $204,732 | $51,142 | $153,590 |
| 2017 | $2,269 | $200,717 | $50,139 | $150,578 |
| 2016 | $2,209 | $196,781 | $49,156 | $147,625 |
| 2015 | $2,195 | $193,826 | $48,418 | $145,408 |
| 2014 | $2,134 | $190,030 | $47,470 | $142,560 |
Map
- 10364 Bristol Dr
- 10337 Bristol Dr
- 10472 Alta Loma Dr
- 6427 Mayberry Ave
- 6280 Kinlock Ave
- 6270 Kinlock Ave
- 10424 Cartilla Ct
- 6212 Dakota Ave
- 10143 Bristol Dr
- 6250 Filkins Ave
- 6245 Dakota Ave
- 6200 Filkins Ave
- 10655 Lemon Ave Unit 2608
- 10655 Lemon Ave Unit 3609
- 10655 Lemon Ave Unit 2709
- 10655 Lemon Ave
- 10655 Lemon Ave Unit 4009
- 10332 Southridge Dr
- 6125 Sherry Ct
- 10340 Charwood Ct
- 10340 Orange St
- 10348 Orange St
- 10320 Orange St
- 10358 Orange St
- 10334 Lemon Ave
- 10366 Orange St
- 10343 Orange St
- 10331 Orange St
- 10324 Lemon Ave
- 10353 Orange St
- 10316 Lemon Ave
- 6276 Revere Ave
- 6287 Revere Ave
- 10363 Orange St
- 10311 Orange St
- 10374 Orange St
- 10340 Bristol Dr
- 6277 Revere Ave
- 6275 Mayberry Ave
- 10346 Bristol Dr
Ask me questions while you tour the home.