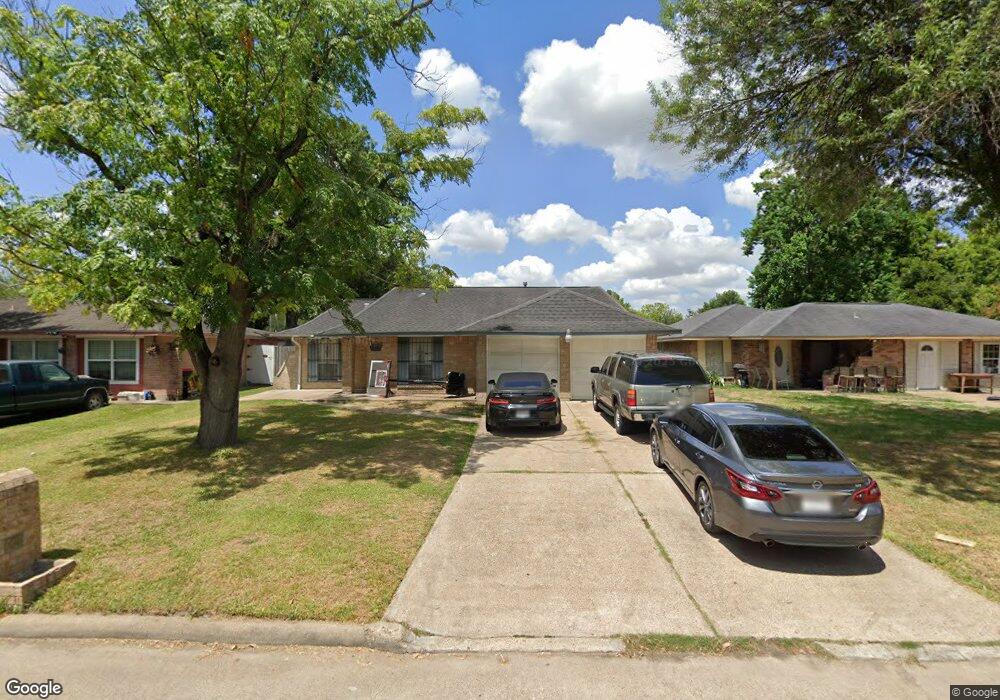
10311 Tilbrook Ct Houston, TX 77038
North Houston NeighborhoodEstimated Value: $172,000 - $227,000
4
Beds
2
Baths
1,240
Sq Ft
$166/Sq Ft
Est. Value
About This Home
This home is located at 10311 Tilbrook Ct, Houston, TX 77038 and is currently estimated at $206,376, approximately $166 per square foot. 10311 Tilbrook Ct is a home located in Harris County with nearby schools including Jerry Keeble Ec/Pre-K, Gray Elementary School, and Aldine Ninth Grade School.
Ownership History
Date
Name
Owned For
Owner Type
Purchase Details
Closed on
Mar 8, 2006
Sold by
Rodriguez Antonio and Rodriguez Amelia
Bought by
Morales Jorge
Current Estimated Value
Home Financials for this Owner
Home Financials are based on the most recent Mortgage that was taken out on this home.
Original Mortgage
$70,400
Outstanding Balance
$39,599
Interest Rate
6.09%
Mortgage Type
Purchase Money Mortgage
Estimated Equity
$166,777
Create a Home Valuation Report for This Property
The Home Valuation Report is an in-depth analysis detailing your home's value as well as a comparison with similar homes in the area
Home Values in the Area
Average Home Value in this Area
Purchase History
| Date | Buyer | Sale Price | Title Company |
|---|---|---|---|
| Morales Jorge | -- | Montgomery County Title Co |
Source: Public Records
Mortgage History
| Date | Status | Borrower | Loan Amount |
|---|---|---|---|
| Open | Morales Jorge | $70,400 |
Source: Public Records
Tax History Compared to Growth
Tax History
| Year | Tax Paid | Tax Assessment Tax Assessment Total Assessment is a certain percentage of the fair market value that is determined by local assessors to be the total taxable value of land and additions on the property. | Land | Improvement |
|---|---|---|---|---|
| 2025 | $2,194 | $221,443 | $33,048 | $188,395 |
| 2024 | $2,194 | $221,443 | $33,048 | $188,395 |
| 2023 | $2,194 | $224,807 | $33,048 | $191,759 |
| 2022 | $3,404 | $177,966 | $27,540 | $150,426 |
| 2021 | $3,226 | $151,377 | $27,540 | $123,837 |
| 2020 | $3,124 | $143,323 | $27,540 | $115,783 |
| 2019 | $2,953 | $131,702 | $27,540 | $104,162 |
| 2018 | $1,091 | $126,457 | $12,636 | $113,821 |
| 2017 | $2,365 | $126,457 | $12,636 | $113,821 |
| 2016 | $2,150 | $102,922 | $12,636 | $90,286 |
| 2015 | $1,445 | $102,922 | $12,636 | $90,286 |
| 2014 | $1,445 | $84,021 | $12,636 | $71,385 |
Source: Public Records
Map
Nearby Homes
- 1219 Pilot Point Dr
- 1138 Cherry Spring Dr
- 1022 Progreso Dr
- 1327 Fallbrook Dr
- 1019 Castolan Dr
- 10519 Pleasanton Dr
- 939 Point Blank Dr
- 00 Fallbrook Dr
- 1010 Francitas Dr
- 1006 Fruitvale Dr
- 10558 Pleasanton Dr
- 1506 Wilshire Park Dr
- 0 W Mt Houston Rd Unit 90464120
- 10226 Ella Falls Blvd
- 10134 Lasaber Ct
- 2115 Havencrest Dr
- 2203 Chalet Rd
- 10026 Lasaber Ct
- 12718 Sai Baba Dr
- 2614 Lemonwood Ln
- 10307 Tilbrook Ct
- 10315 Tilbrook Ct
- 10310 Summerbrook Ct
- 10303 Tilbrook Ct
- 10306 Summerbrook Ct
- 10319 Tilbrook Ct
- 10314 Summerbrook Ct
- 10302 Summerbrook Ct
- 10310 Tilbrook Ct
- 10306 Tilbrook Ct
- 10314 Tilbrook Ct
- 10323 Tilbrook Ct
- 10302 Tilbrook Ct
- 10318 Tilbrook Ct
- 10318 Summerbrook Ct
- 1123 Dellbrook Dr
- 10322 Tilbrook Ct
- 1127 Dellbrook Dr
- 1119 Dellbrook Dr
- 1131 Dellbrook Dr