10318 Hammerly Blvd Unit 172 Houston, TX 77043
Spring Shadows NeighborhoodEstimated Value: $195,000 - $210,000
3
Beds
3
Baths
1,716
Sq Ft
$118/Sq Ft
Est. Value
About This Home
This home is located at 10318 Hammerly Blvd Unit 172, Houston, TX 77043 and is currently estimated at $202,635, approximately $118 per square foot. 10318 Hammerly Blvd Unit 172 is a home located in Harris County with nearby schools including Westwood Elementary School, Spring Oaks Middle School, and Spring Woods High School.
Ownership History
Date
Name
Owned For
Owner Type
Purchase Details
Closed on
Aug 21, 2017
Sold by
Chetty Sarojini
Bought by
Smith James
Current Estimated Value
Home Financials for this Owner
Home Financials are based on the most recent Mortgage that was taken out on this home.
Original Mortgage
$104,000
Outstanding Balance
$86,943
Interest Rate
4.03%
Mortgage Type
New Conventional
Estimated Equity
$115,692
Purchase Details
Closed on
May 21, 2017
Sold by
Chetty Sarojini and Chetty Perumal
Bought by
Chetty Sarojini
Purchase Details
Closed on
Aug 25, 2000
Sold by
Mintz Barbara J and Mintz Don
Bought by
Chetty Perumal and Chetty Sarojini
Home Financials for this Owner
Home Financials are based on the most recent Mortgage that was taken out on this home.
Original Mortgage
$71,500
Interest Rate
8.21%
Mortgage Type
Stand Alone First
Create a Home Valuation Report for This Property
The Home Valuation Report is an in-depth analysis detailing your home's value as well as a comparison with similar homes in the area
Home Values in the Area
Average Home Value in this Area
Purchase History
| Date | Buyer | Sale Price | Title Company |
|---|---|---|---|
| Smith James | -- | None Available | |
| Chetty Sarojini | -- | None Available | |
| Chetty Perumal | -- | Alamo Title Company |
Source: Public Records
Mortgage History
| Date | Status | Borrower | Loan Amount |
|---|---|---|---|
| Open | Smith James | $104,000 | |
| Previous Owner | Chetty Perumal | $71,500 | |
| Closed | Chetty Perumal | $10,725 |
Source: Public Records
Tax History Compared to Growth
Tax History
| Year | Tax Paid | Tax Assessment Tax Assessment Total Assessment is a certain percentage of the fair market value that is determined by local assessors to be the total taxable value of land and additions on the property. | Land | Improvement |
|---|---|---|---|---|
| 2025 | $4,321 | $198,530 | $60,000 | $138,530 |
| 2024 | $4,321 | $196,040 | $60,000 | $136,040 |
| 2023 | $4,321 | $194,278 | $60,000 | $134,278 |
| 2022 | $4,299 | $176,320 | $60,000 | $116,320 |
| 2021 | $3,801 | $155,680 | $50,000 | $105,680 |
| 2020 | $4,056 | $155,680 | $50,000 | $105,680 |
| 2019 | $4,089 | $150,453 | $40,000 | $110,453 |
| 2018 | $1,694 | $138,450 | $40,000 | $98,450 |
| 2017 | $2,965 | $138,450 | $40,000 | $98,450 |
| 2016 | $2,696 | $138,450 | $40,000 | $98,450 |
| 2015 | $1,604 | $121,909 | $35,000 | $86,909 |
| 2014 | $1,604 | $85,156 | $20,000 | $65,156 |
Source: Public Records
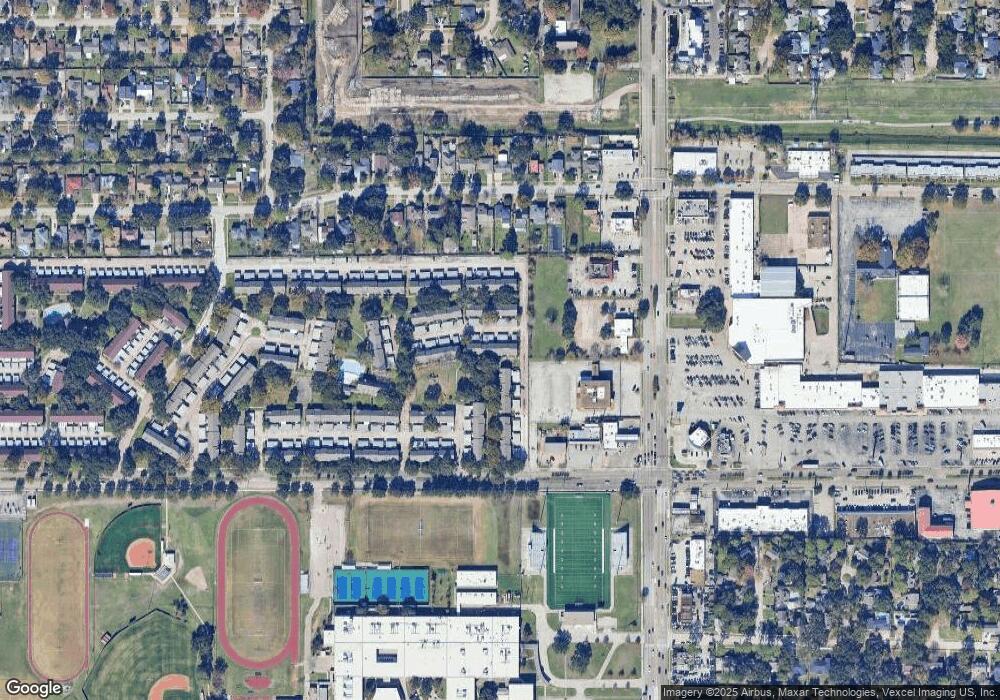
Map
Nearby Homes
- 2342 Triway Ln Unit 147
- 10382 Hammerly Blvd
- 10227 Emnora Ln
- 10466 Hammerly Blvd Unit 70
- 10488 Hammerly Blvd Unit 81
- 2233 Triway Ln Unit 267
- 2219 Triway Ln Unit 240
- 2103 Southwick St
- 10415 Westray St
- 10214 Moorberry Ln
- 2252 Shadowdale Dr Unit 362
- 2535 Southwick St
- 2212 Shadowdale Dr Unit 358
- 2603 Durban Dr
- 10226 Rothbury St
- 2202 Shadowdale Dr Unit 353
- 2106 Teague Rd
- 2102 Teague Rd
- 2506 Teague Rd
- 10227 Knoboak Dr
- 10316 Hammerly Blvd Unit 173
- 10322 Hammerly Blvd Unit 170
- 10314 Hammerly Blvd Unit 174
- 10312 Hammerly Blvd Unit 175
- 10324 Hammerly Blvd Unit 12
- 10310 Hammerly Blvd Unit 176
- 10326 Hammerly Blvd Unit 11
- 10328 Hammerly Blvd Unit 10
- 10258 Hammerly Blvd Unit 165
- 10256 Hammerly Blvd Unit 164
- 10260 Hammerly Blvd Unit 166
- 10260 Hammerly Bl
- 10254 Hammerly Blvd Unit 163
- 10262 Hammerly Blvd Unit 167
- 10308 Hammerly Blvd Unit 177
- 10264 Hammerly Blvd Unit 168
- 10330 Hammerly Blvd Unit 9
- 10266 Hammerly Blvd Unit 169
- 10306 Hammerly Blvd Unit 178
- 10332 Hammerly Blvd Unit 8