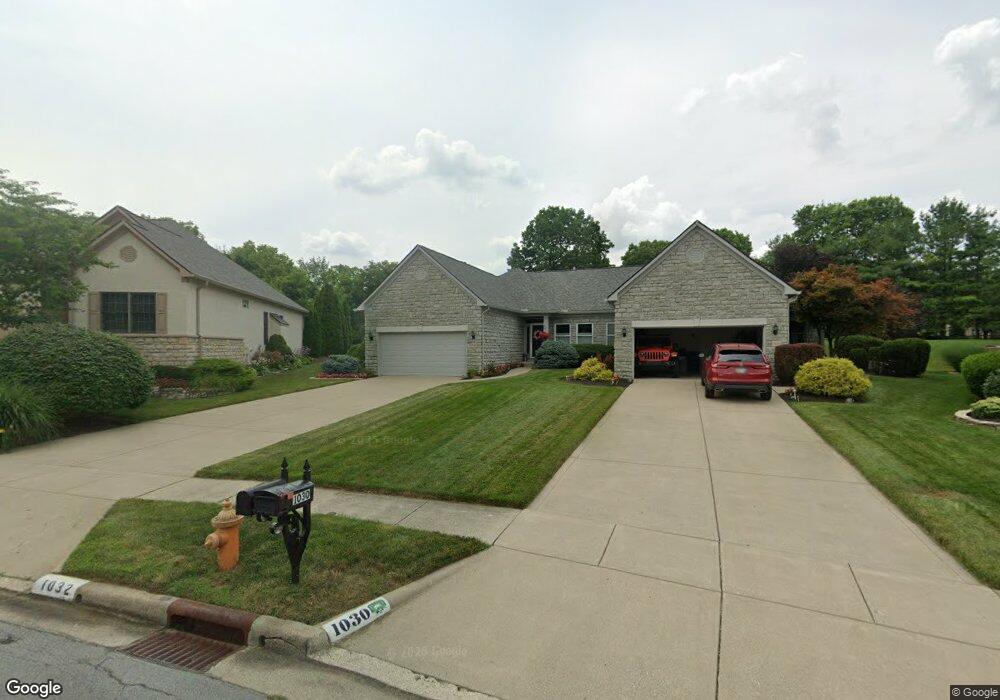
1032 Augusta Glen Dr Columbus, OH 43235
Linworth Village NeighborhoodEstimated Value: $438,917 - $513,000
2
Beds
2
Baths
1,673
Sq Ft
$292/Sq Ft
Est. Value
About This Home
This home is located at 1032 Augusta Glen Dr, Columbus, OH 43235 and is currently estimated at $488,479, approximately $291 per square foot. 1032 Augusta Glen Dr is a home located in Franklin County with nearby schools including Gables Elementary School, Ridgeview Middle School, and Centennial High School.
Ownership History
Date
Name
Owned For
Owner Type
Purchase Details
Closed on
Mar 27, 2000
Sold by
Newman Ronda J
Bought by
Bernard Antoinette C
Current Estimated Value
Home Financials for this Owner
Home Financials are based on the most recent Mortgage that was taken out on this home.
Original Mortgage
$115,000
Outstanding Balance
$39,087
Interest Rate
8.12%
Mortgage Type
Purchase Money Mortgage
Estimated Equity
$449,392
Purchase Details
Closed on
Jan 29, 1999
Sold by
Morrone Okeefe Development Company
Bought by
Newman Ronda J
Home Financials for this Owner
Home Financials are based on the most recent Mortgage that was taken out on this home.
Original Mortgage
$184,100
Interest Rate
6.81%
Purchase Details
Closed on
Nov 3, 1997
Sold by
Okeefe Terraence D
Bought by
Morrone Okeefe Development Company
Purchase Details
Closed on
Sep 22, 1997
Sold by
Okeefe Terrence D
Bought by
Morrone Okeefe Development Company
Create a Home Valuation Report for This Property
The Home Valuation Report is an in-depth analysis detailing your home's value as well as a comparison with similar homes in the area
Home Values in the Area
Average Home Value in this Area
Purchase History
| Date | Buyer | Sale Price | Title Company |
|---|---|---|---|
| Bernard Antoinette C | $215,000 | Chicago Title | |
| Newman Ronda J | $193,800 | Celtic Title Agency Inc | |
| Morrone Okeefe Development Company | -- | -- | |
| Morrone Okeefe Development Company | -- | -- |
Source: Public Records
Mortgage History
| Date | Status | Borrower | Loan Amount |
|---|---|---|---|
| Open | Bernard Antoinette C | $115,000 | |
| Previous Owner | Newman Ronda J | $184,100 |
Source: Public Records
Tax History Compared to Growth
Tax History
| Year | Tax Paid | Tax Assessment Tax Assessment Total Assessment is a certain percentage of the fair market value that is determined by local assessors to be the total taxable value of land and additions on the property. | Land | Improvement |
|---|---|---|---|---|
| 2024 | $5,371 | $129,470 | $50,330 | $79,140 |
| 2023 | $5,330 | $129,465 | $50,330 | $79,135 |
| 2022 | $4,985 | $104,870 | $19,710 | $85,160 |
| 2021 | $4,994 | $104,870 | $19,710 | $85,160 |
| 2020 | $5,001 | $104,870 | $19,710 | $85,160 |
| 2019 | $4,556 | $83,860 | $15,750 | $68,110 |
| 2018 | $4,252 | $83,860 | $15,750 | $68,110 |
| 2017 | $4,457 | $83,860 | $15,750 | $68,110 |
| 2016 | $4,359 | $74,560 | $16,210 | $58,350 |
| 2015 | $3,957 | $74,560 | $16,210 | $58,350 |
| 2014 | $3,967 | $74,560 | $16,210 | $58,350 |
| 2013 | $1,957 | $74,550 | $16,205 | $58,345 |
Source: Public Records
Map
Nearby Homes
- 928 Linworth Village Dr
- 895 Linworth Village Dr
- 1246 Southport Dr
- 5773 Middlefield Dr
- 1213 Nantucket Ave
- 5854 Aqua Bay Dr Unit 5854
- 5881 Rocky Rill Rd
- 5936 Aqua Bay Dr
- 5938 Aqua Bay Dr
- 1505 Eastmeadow Place
- 5363 Godown Rd
- 6041 Rocky Rill Rd
- 1161 Bethel Rd Unit 103/104
- 1540 Slade Ave Unit 303
- 1147 Langland Dr
- 511 W Kanawha Ave
- 838 Cambridge Ct
- 409 Fenway Rd
- 5111 Portland St
- 1683 Saint Albans Ct Unit 22-83
- 1030 Augusta Glen Dr
- 5377 Castle Pines
- 1024 Augusta Glen Dr
- 5375 Castle Pines
- 1022 Augusta Glen Dr
- 1025 Augusta Glen Dr
- 5373 Castle Pines
- 1018 Augusta Glen Dr
- 5371 Castle Pines
- 5345 Banbury Dr
- 1017 Augusta Glen Dr
- 1010 Augusta Glen Dr
- 5367 Castle Pines
- 994 Medinah Terrace
- 1077 Larkstone Dr
- 1009 Augusta Glen Dr
- 1002 Augusta Glen Dr
- 992 Medinah Terrace
- 5365 Castle Pines
- 5353 Banbury Dr