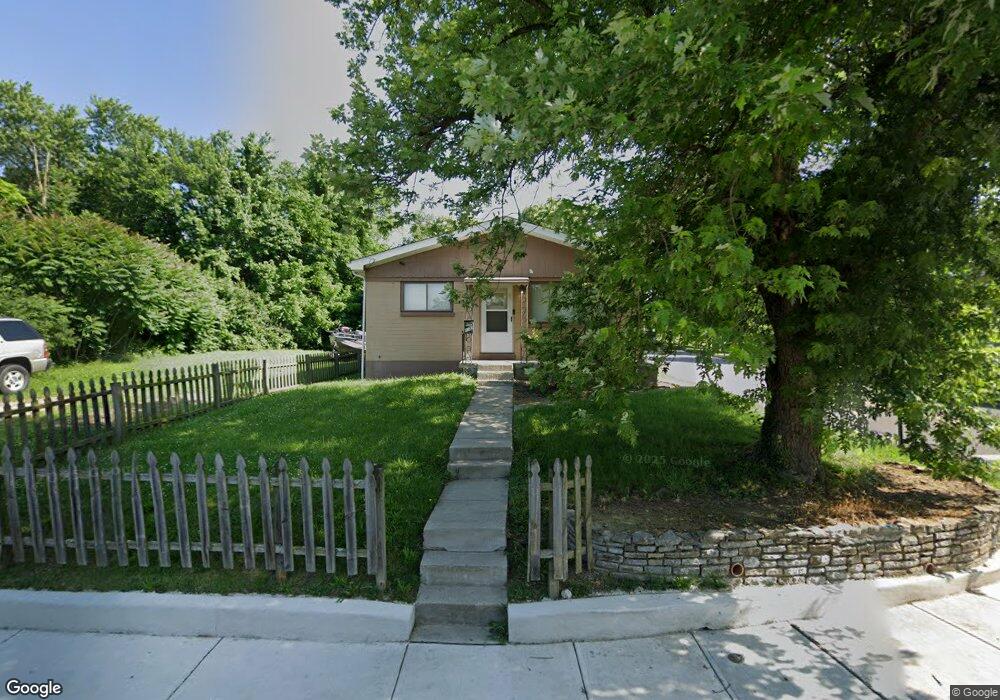
1032 Chamberlain Ave Cincinnati, OH 45215
Estimated Value: $96,000 - $141,000
2
Beds
1
Bath
1,134
Sq Ft
$104/Sq Ft
Est. Value
About This Home
This home is located at 1032 Chamberlain Ave, Cincinnati, OH 45215 and is currently estimated at $118,339, approximately $104 per square foot. 1032 Chamberlain Ave is a home located in Hamilton County with nearby schools including Lincoln Heights Elementary School, Princeton Community Middle School, and Princeton High School.
Ownership History
Date
Name
Owned For
Owner Type
Purchase Details
Closed on
Apr 8, 2022
Sold by
Eddie Crossty
Bought by
Smith Pamela
Current Estimated Value
Purchase Details
Closed on
Oct 29, 2015
Sold by
Crossty Mary Ann
Bought by
Crossty Eddie Antonio
Purchase Details
Closed on
Jan 19, 2011
Sold by
Griffith Pamela J
Bought by
Crossty Mary Ann
Purchase Details
Closed on
Nov 27, 2007
Sold by
Griffith Pamela J
Bought by
Emery Fcu
Purchase Details
Closed on
Aug 11, 1997
Sold by
Thompson Bobby and Thompson Dianne
Bought by
Griffith Pamela J
Home Financials for this Owner
Home Financials are based on the most recent Mortgage that was taken out on this home.
Original Mortgage
$55,834
Interest Rate
7.71%
Mortgage Type
FHA
Create a Home Valuation Report for This Property
The Home Valuation Report is an in-depth analysis detailing your home's value as well as a comparison with similar homes in the area
Home Values in the Area
Average Home Value in this Area
Purchase History
| Date | Buyer | Sale Price | Title Company |
|---|---|---|---|
| Smith Pamela | $40,000 | None Listed On Document | |
| Crossty Eddie Antonio | -- | None Available | |
| Crossty Mary Ann | $15,598 | Attorney | |
| Emery Fcu | $11,562 | None Available | |
| Griffith Pamela J | $56,000 | -- |
Source: Public Records
Mortgage History
| Date | Status | Borrower | Loan Amount |
|---|---|---|---|
| Previous Owner | Griffith Pamela J | $55,834 |
Source: Public Records
Tax History
| Year | Tax Paid | Tax Assessment Tax Assessment Total Assessment is a certain percentage of the fair market value that is determined by local assessors to be the total taxable value of land and additions on the property. | Land | Improvement |
|---|---|---|---|---|
| 2025 | $2,355 | $29,863 | $1,236 | $28,627 |
| 2024 | $1,948 | $29,863 | $1,236 | $28,627 |
| 2023 | $1,961 | $29,863 | $1,236 | $28,627 |
| 2022 | $1,242 | $11,894 | $1,236 | $10,658 |
| 2021 | $1,237 | $11,894 | $1,236 | $10,658 |
| 2020 | $1,228 | $11,894 | $1,236 | $10,658 |
| 2019 | $1,295 | $11,894 | $1,236 | $10,658 |
| 2018 | $1,254 | $11,894 | $1,236 | $10,658 |
| 2017 | $1,377 | $11,894 | $1,236 | $10,658 |
| 2016 | $394 | $4,365 | $1,561 | $2,804 |
| 2015 | $416 | $4,365 | $1,561 | $2,804 |
| 2014 | $421 | $4,365 | $1,561 | $2,804 |
| 2013 | $512 | $5,459 | $1,953 | $3,506 |
Source: Public Records
Map
Nearby Homes
- 1282 Steffen Ave
- 857 Steffen Ave
- 1401 Chamberlain Ave
- 1076 Schumard Ave
- 1201 Dixie Ct
- 519 Westview Ave
- 405 Home Ave
- 1118 Burns Ave
- 10152 Chester Rd
- 1100 Timberland Dr
- 1019 Crosley Ave
- 15 Bonham Rd
- 502 Marion Rd
- 1239 Springfield Pike
- 1704 Harmon Dr
- 10167 Wayne Ave
- 29 Forest Ave
- 11 Rolling Hills Ct
- 127 Locust St
- 0 E Leslie Ave
- 1010 Chamberlain Ave
- 1054 Chamberlain Ave
- 1000 Chamberlain Ave
- 988 Chamberlain Ave
- 1019 Chamberlain Ave
- 1027 Lindy Ave
- 1011 Chamberlain Ave
- 1055 Chamberlain Ave
- 1001 Chamberlain Ave
- 976 Chamberlain Ave
- 1067 Chamberlain Ave
- 967 Lindy Ave
- 989 Chamberlain Ave
- 1100 Chamberlain Ave
- 977 Lindy Ave
- 1032 Byrd Ave
- 1022 Byrd Ave
- 1101 Lindy Ave
- 1101 Lindy Ave Unit 39
- 1054 Byrd Ave
Your Personal Tour Guide
Ask me questions while you tour the home.