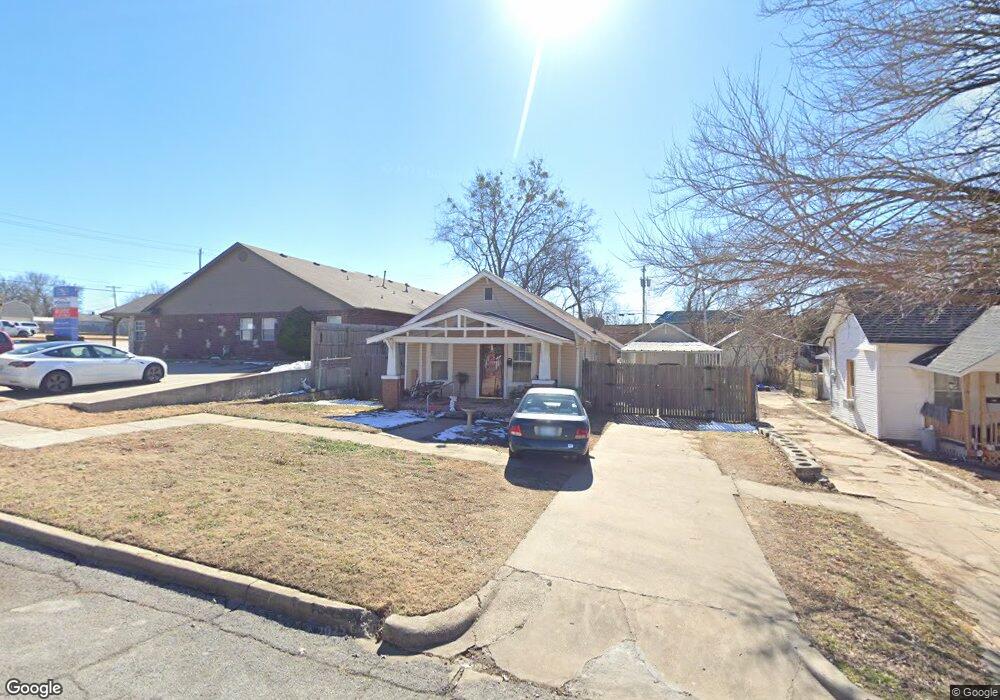
1032 E Mckinley Ave Sapulpa, OK 74066
Estimated Value: $101,000 - $147,000
3
Beds
2
Baths
1,086
Sq Ft
$116/Sq Ft
Est. Value
About This Home
This home is located at 1032 E Mckinley Ave, Sapulpa, OK 74066 and is currently estimated at $125,920, approximately $115 per square foot. 1032 E Mckinley Ave is a home located in Creek County with nearby schools including Sapulpa Junior High School, Sapulpa Middle School, and Sapulpa High School.
Ownership History
Date
Name
Owned For
Owner Type
Purchase Details
Closed on
May 12, 2022
Sold by
Shawn Hopkins Jerry
Bought by
Mcspadden David and Mcspadden Karen
Current Estimated Value
Purchase Details
Closed on
Aug 14, 2020
Sold by
Beyco Inc
Bought by
Hopkins Jerry B and Hopkins Tracy S
Purchase Details
Closed on
Oct 3, 2005
Sold by
Beyer David L and Beyer Vickie L
Bought by
Beyco Inc
Home Financials for this Owner
Home Financials are based on the most recent Mortgage that was taken out on this home.
Original Mortgage
$57,600
Interest Rate
5.8%
Mortgage Type
New Conventional
Purchase Details
Closed on
Sep 16, 2005
Sold by
Beyco Inc
Bought by
Beyer David L and Beyer Vickie L
Home Financials for this Owner
Home Financials are based on the most recent Mortgage that was taken out on this home.
Original Mortgage
$57,600
Interest Rate
5.8%
Mortgage Type
New Conventional
Create a Home Valuation Report for This Property
The Home Valuation Report is an in-depth analysis detailing your home's value as well as a comparison with similar homes in the area
Home Values in the Area
Average Home Value in this Area
Purchase History
| Date | Buyer | Sale Price | Title Company |
|---|---|---|---|
| Mcspadden David | -- | None Listed On Document | |
| Hopkins Jerry B | $60,000 | Creek County Abstract Co | |
| Beyco Inc | -- | None Available | |
| Beyer David L | -- | None Available |
Source: Public Records
Mortgage History
| Date | Status | Borrower | Loan Amount |
|---|---|---|---|
| Previous Owner | Beyer David L | $57,600 |
Source: Public Records
Tax History Compared to Growth
Tax History
| Year | Tax Paid | Tax Assessment Tax Assessment Total Assessment is a certain percentage of the fair market value that is determined by local assessors to be the total taxable value of land and additions on the property. | Land | Improvement |
|---|---|---|---|---|
| 2025 | $1,029 | $8,645 | $5,040 | $3,605 |
| 2024 | $1,001 | $8,233 | $4,800 | $3,433 |
| 2023 | $1,001 | $7,841 | $4,800 | $3,041 |
| 2022 | $858 | $7,468 | $4,800 | $2,668 |
| 2021 | $844 | $7,112 | $4,800 | $2,312 |
| 2020 | $479 | $4,064 | $1,800 | $2,264 |
| 2019 | $459 | $3,870 | $1,800 | $2,070 |
| 2018 | $446 | $3,686 | $1,800 | $1,886 |
| 2017 | $444 | $3,686 | $1,800 | $1,886 |
| 2016 | $422 | $3,686 | $1,800 | $1,886 |
| 2015 | -- | $3,686 | $1,800 | $1,886 |
| 2014 | -- | $3,686 | $1,800 | $1,886 |
Source: Public Records
Map
Nearby Homes
- 319 S Division St
- 1010 E Thompson Ave
- 1033 E Thompson Ave
- 1023 E Thompson Ave
- 706 E Thompson Ave
- 511 S Maple St
- 1140 E Hobson Ave
- 207 S Walnut St
- 1136 E Mcleod Ave
- 0 Division St Unit 2535888
- 320 E Mckinley Ave
- 1002 E Line Ave
- 507 S Park St
- 813 E Teresa Ave
- 612 S Park St
- 6 Mayfield St
- 1103 S Division St
- 1109 S Division St
- 1440 Mabelle Dr
- 210 S Water St
- 1030 E Mckinley Ave
- 1020 E Mckinley Ave
- 400 S Mission St
- 1018 E Mckinley Ave
- 1016 E Mckinley Ave
- 1102 E Mckinley Ave
- 1035 E Mckinley Ave
- 1037 E Mckinley Ave
- 1027 E Mckinley Ave
- 1012 E Mckinley Ave
- 401 S Mission St
- 1025 E Mckinley Ave
- 330 S Mission St
- null Sapulpa 2mi E 117hwy
- null Sapulpa Rr
- null Sapulpa Rt 4
- null Sapulpa Rt 2
- null Sapulpa Rt 1
- 1021 E Mckinley Ave
- 1108 E Mckinley Ave