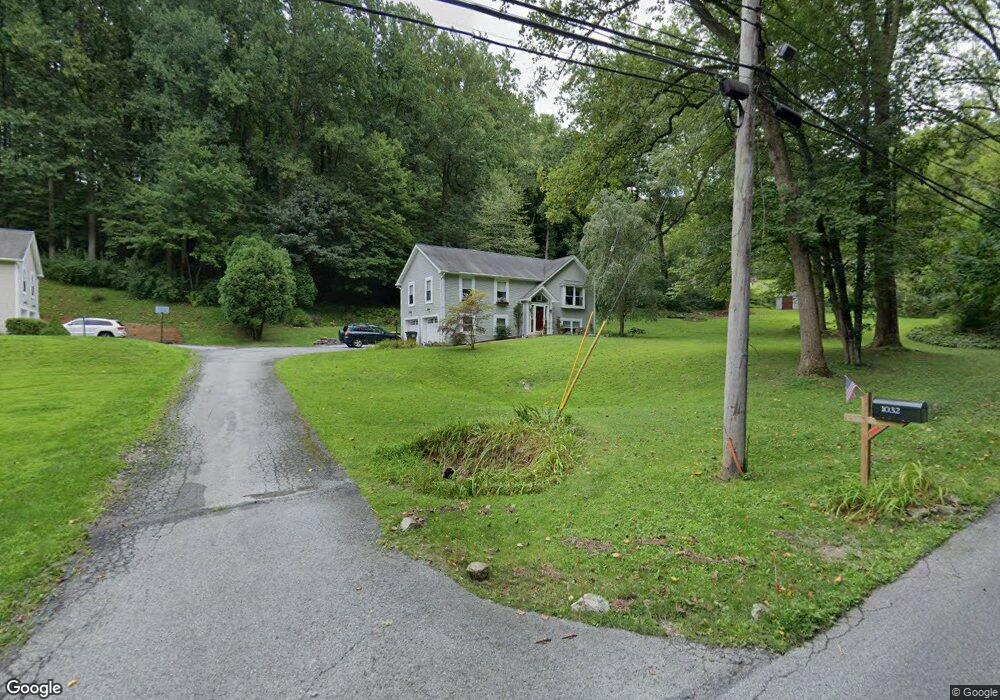
1032 Glenside Rd Downingtown, PA 19335
Estimated Value: $456,794 - $541,000
3
Beds
2
Baths
1,210
Sq Ft
$422/Sq Ft
Est. Value
About This Home
This home is located at 1032 Glenside Rd, Downingtown, PA 19335 and is currently estimated at $510,699, approximately $422 per square foot. 1032 Glenside Rd is a home located in Chester County with nearby schools including Bradford Heights Elementary School, Downingtown Middle School, and Downingtown High School West.
Ownership History
Date
Name
Owned For
Owner Type
Purchase Details
Closed on
Jun 28, 2005
Sold by
Vitello Todd C
Bought by
Snell Kent and Snell Jacqueline
Current Estimated Value
Home Financials for this Owner
Home Financials are based on the most recent Mortgage that was taken out on this home.
Original Mortgage
$142,000
Outstanding Balance
$74,174
Interest Rate
5.67%
Mortgage Type
Fannie Mae Freddie Mac
Estimated Equity
$436,525
Purchase Details
Closed on
Dec 29, 2001
Sold by
Vitello Todd C and Vitello Staci M
Bought by
Vitello Todd C
Home Financials for this Owner
Home Financials are based on the most recent Mortgage that was taken out on this home.
Original Mortgage
$140,000
Interest Rate
7.15%
Purchase Details
Closed on
Oct 16, 1995
Sold by
Fisher Daniel S
Bought by
Vitello Todd C and Vitello Staci M
Home Financials for this Owner
Home Financials are based on the most recent Mortgage that was taken out on this home.
Original Mortgage
$134,550
Interest Rate
7.6%
Create a Home Valuation Report for This Property
The Home Valuation Report is an in-depth analysis detailing your home's value as well as a comparison with similar homes in the area
Home Values in the Area
Average Home Value in this Area
Purchase History
| Date | Buyer | Sale Price | Title Company |
|---|---|---|---|
| Snell Kent | $280,000 | -- | |
| Vitello Todd C | -- | Fidelity National Title Ins | |
| Vitello Todd C | $141,682 | -- |
Source: Public Records
Mortgage History
| Date | Status | Borrower | Loan Amount |
|---|---|---|---|
| Open | Snell Kent | $142,000 | |
| Previous Owner | Vitello Todd C | $140,000 | |
| Previous Owner | Vitello Todd C | $134,550 |
Source: Public Records
Tax History Compared to Growth
Tax History
| Year | Tax Paid | Tax Assessment Tax Assessment Total Assessment is a certain percentage of the fair market value that is determined by local assessors to be the total taxable value of land and additions on the property. | Land | Improvement |
|---|---|---|---|---|
| 2025 | $5,153 | $148,900 | $75,830 | $73,070 |
| 2024 | $5,153 | $148,900 | $75,830 | $73,070 |
| 2023 | $5,004 | $148,900 | $75,830 | $73,070 |
| 2022 | $4,880 | $148,900 | $75,830 | $73,070 |
| 2021 | $4,799 | $148,900 | $75,830 | $73,070 |
| 2020 | $4,772 | $148,900 | $75,830 | $73,070 |
| 2019 | $4,698 | $148,900 | $75,830 | $73,070 |
| 2018 | $4,698 | $148,900 | $75,830 | $73,070 |
| 2017 | $4,698 | $148,900 | $75,830 | $73,070 |
| 2016 | $4,366 | $148,900 | $75,830 | $73,070 |
| 2015 | $4,366 | $148,900 | $75,830 | $73,070 |
| 2014 | $4,366 | $148,900 | $75,830 | $73,070 |
Source: Public Records
Map
Nearby Homes
- 1012 Glenside Rd Unit C
- 1012 Glenside Rd Unit B
- 1012 Glenside Rd Unit A
- 1012 Glenside Rd Unit P
- 125 Victor Dr
- 129 Victor Dr
- 127 Victor Dr
- Chandler Plan at Downingtown Ridge - Chandler Townhomes
- Chase Plan at Downingtown Ridge - Chase Townhomes
- 126 Abramo Victor Dr
- 222 Bradford Ave
- 230 Church St
- 112 Bradford Ave
- 604 Highland Ave
- 1309 Richmond Place
- 137 W Lancaster Ave
- 115 Whelen Ave
- 1307 Pennsridge Place
- 390 Mary St
- 161 Jefferson Ave
- 1030 Glenside Rd
- 1024 Glenside Rd
- 1031 Glenside Rd
- 1051 Glenside Rd
- 1068 Glenside Rd
- 1071 Glenside Rd
- 1035 Glenside Rd
- 1027 Glenside Rd
- 1012 Glenside Rd
- 1041 Glenside Rd
- 1437 Carolina Place
- 1070 Glenside Rd
- 1439 Carolina Place
- 1000 Glenside Rd
- 1085 Glenside Rd
- 1441 Carolina Place
- 1087 Glenside Rd
- 1043 Glenside Rd
- 990 Glenside Rd
- 1435 Carolina Place