
Seller's Agent in 2015
Kathleen Citro
Davis & Associates, REALTORS
(217) 653-9301
75 in this area
82 Total Sales

Estimated Value: $589,000 - $699,000
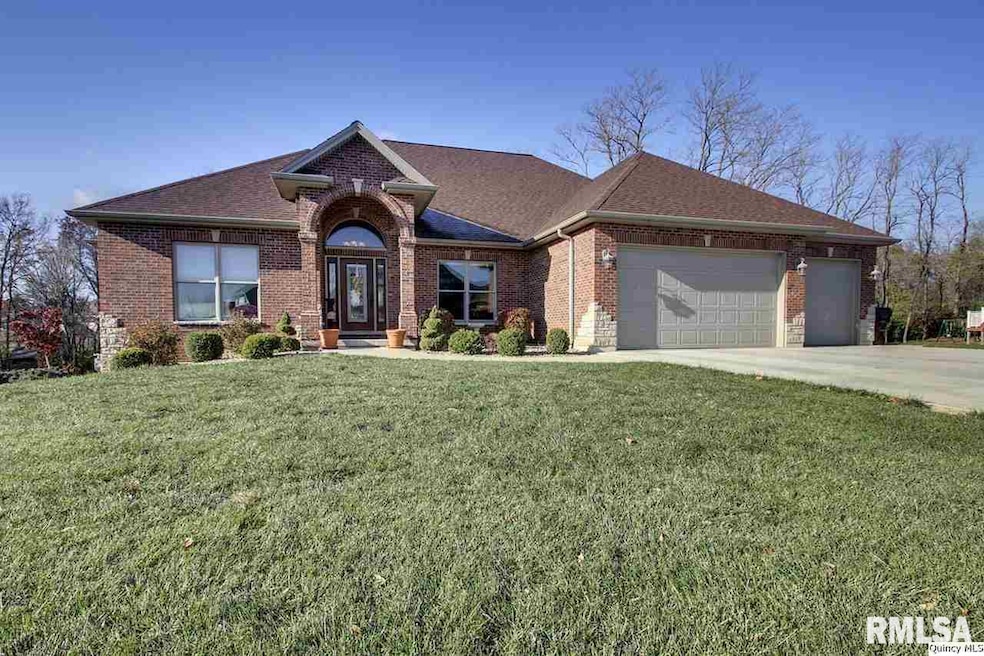
The entrance will wow you! Beautiful open space dramatically enhanced by windowed view of woods. Shining Brazilian cherry floors, high ceilings, open staircase, kitchen pantry. Composite deck off kitchen. 2 laundry rooms, one with cedar closet. Sunny, daylight finished basement walks out to patio & 20x40 ft in ground pool with locking safety cover. Private master bedroom suite. Solidly built with many upgrades. Pool is salt water so far less chemical & cost to maintain. All this on 1 acre lot in great southeast location.
Last Agent to Sell the Property
Davis & Associates, REALTORS License #475126427 Listed on: 11/20/2014
Last Buyer's Agent
Out of Area Out of Area
OUT OF AREA FIRM License #475085083
| Date | Event | Price | List to Sale | Price per Sq Ft |
|---|---|---|---|---|
| 04/01/2015 04/01/15 | Sold | $423,000 | -3.8% | -- |
| 03/02/2015 03/02/15 | Pending | -- | -- | -- |
| 11/20/2014 11/20/14 | For Sale | $439,900 | -- | -- |
| Year | Tax Paid | Tax Assessment Tax Assessment Total Assessment is a certain percentage of the fair market value that is determined by local assessors to be the total taxable value of land and additions on the property. | Land | Improvement |
|---|---|---|---|---|
| 2024 | $11,079 | $175,910 | $22,710 | $153,200 |
| 2023 | $10,400 | $163,200 | $21,070 | $142,130 |
| 2022 | $9,809 | $152,380 | $19,670 | $132,710 |
| 2021 | $9,876 | $149,310 | $19,270 | $130,040 |
| 2020 | $9,680 | $146,390 | $18,890 | $127,500 |
| 2019 | $9,493 | $144,820 | $18,690 | $126,130 |
| 2018 | $9,632 | $145,200 | $19,440 | $125,760 |
| 2017 | $9,388 | $143,760 | $19,250 | $124,510 |
| 2016 | $9,208 | $137,910 | $18,470 | $119,440 |
| 2015 | $7,699,780 | $121,140 | $18,470 | $102,670 |
| 2012 | $7,698 | $117,100 | $17,860 | $99,240 |
Seller's Agent in 2015
Kathleen Citro
Davis & Associates, REALTORS
(217) 653-9301
75 in this area
82 Total Sales
O
Buyer's Agent in 2015
Out of Area Out of Area
OUT OF AREA FIRM
Source: RMLS Alliance
MLS Number: RMACA191687_1
APN: 23-9-0218-006-00
Disclaimer: Certain information contained herein is derived from information provided by parties other than Homes.com. All information provided is deemed reliable, but is not guaranteed to be accurate and should be independently verified.
![]() Based on information submitted to the MLS GRID. All data is obtained from various sources and may not have been verified by broker or MLS GRID. Supplied Open House Information is subject to change without notice. All information should be independently reviewed and verified for accuracy. Properties may or may not be listed by the office/agent presenting the information. Some IDX listings have been excluded from this website.IDX information is provided exclusively for personal, non-commercial use, and may not be used for any purpose other than to identify prospective properties consumers may be interested in purchasing. Information is deemed reliable but not guaranteed.
Based on information submitted to the MLS GRID. All data is obtained from various sources and may not have been verified by broker or MLS GRID. Supplied Open House Information is subject to change without notice. All information should be independently reviewed and verified for accuracy. Properties may or may not be listed by the office/agent presenting the information. Some IDX listings have been excluded from this website.IDX information is provided exclusively for personal, non-commercial use, and may not be used for any purpose other than to identify prospective properties consumers may be interested in purchasing. Information is deemed reliable but not guaranteed.
Based on information submitted to the MLS GRID
Ask me questions while you tour the home.