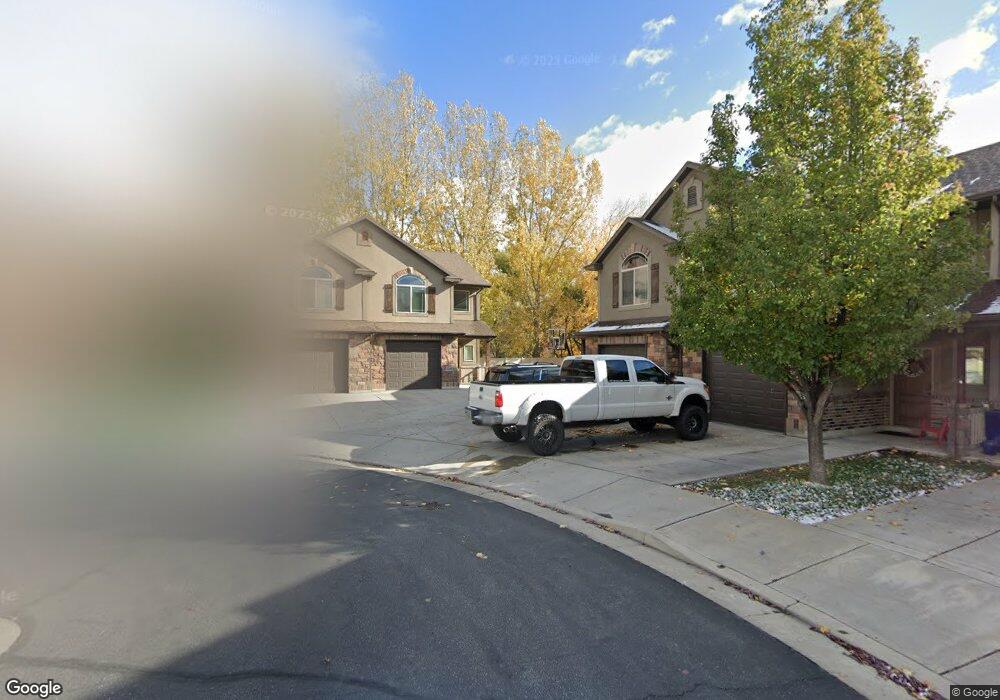
1032 W 950 N Layton, UT 84041
Estimated Value: $372,000 - $385,000
3
Beds
2
Baths
1,565
Sq Ft
$241/Sq Ft
Est. Value
About This Home
This home is located at 1032 W 950 N, Layton, UT 84041 and is currently estimated at $376,754, approximately $240 per square foot. 1032 W 950 N is a home located in Davis County with nearby schools including Central Davis Junior High School, Layton High School, and North Davis Preparatory Academy.
Ownership History
Date
Name
Owned For
Owner Type
Purchase Details
Closed on
Mar 8, 2021
Sold by
Davis Richard L and Davis Almae O
Bought by
Anasazi Properties Llc
Current Estimated Value
Purchase Details
Closed on
Mar 16, 2020
Sold by
Freter Lauren and Freter Gayla
Bought by
Davis Richard L and Davis Almee O
Home Financials for this Owner
Home Financials are based on the most recent Mortgage that was taken out on this home.
Original Mortgage
$198,000
Interest Rate
3.4%
Mortgage Type
New Conventional
Purchase Details
Closed on
Mar 30, 2010
Sold by
Nilson & Company Inc
Bought by
Elwood Cecilla M
Home Financials for this Owner
Home Financials are based on the most recent Mortgage that was taken out on this home.
Original Mortgage
$128,000
Interest Rate
4.88%
Mortgage Type
New Conventional
Create a Home Valuation Report for This Property
The Home Valuation Report is an in-depth analysis detailing your home's value as well as a comparison with similar homes in the area
Home Values in the Area
Average Home Value in this Area
Purchase History
| Date | Buyer | Sale Price | Title Company |
|---|---|---|---|
| Anasazi Properties Llc | -- | Title Guarantee Se | |
| Davis Richard L | -- | First American Titl | |
| Elwood Cecilla M | -- | Bonneville Superior Ti |
Source: Public Records
Mortgage History
| Date | Status | Borrower | Loan Amount |
|---|---|---|---|
| Previous Owner | Davis Richard L | $198,000 | |
| Previous Owner | Elwood Cecilla M | $128,000 |
Source: Public Records
Tax History
| Year | Tax Paid | Tax Assessment Tax Assessment Total Assessment is a certain percentage of the fair market value that is determined by local assessors to be the total taxable value of land and additions on the property. | Land | Improvement |
|---|---|---|---|---|
| 2025 | $1,860 | $195,250 | $57,200 | $138,050 |
| 2024 | $1,805 | $190,850 | $43,450 | $147,400 |
| 2023 | $1,856 | $190,300 | $41,800 | $148,500 |
| 2022 | $1,891 | $348,000 | $73,000 | $275,000 |
| 2021 | $1,749 | $264,000 | $60,000 | $204,000 |
| 2020 | $1,616 | $234,000 | $58,800 | $175,200 |
| 2019 | $1,593 | $226,000 | $56,500 | $169,500 |
| 2018 | $1,426 | $203,000 | $50,000 | $153,000 |
| 2016 | $1,223 | $89,870 | $15,400 | $74,470 |
| 2015 | $1,210 | $84,370 | $15,400 | $68,970 |
| 2014 | $1,151 | $82,079 | $18,333 | $63,746 |
| 2013 | -- | $93,192 | $15,400 | $77,792 |
Source: Public Records
Map
Nearby Homes
- 1171 W Gordon Ave
- 1676 N Main St
- 1366 N Main St Unit 5
- 1113 W Angel Hill Ct
- 1677 N 1600 W Unit 134
- 1187 W Seraphim Ct
- 1358 Marilyn Dr
- 789 N Hill Villa Dr
- 526 King St Unit 2
- 1500 N Angel St Unit 12
- 1500 N Angel St Unit 22
- 1500 N Angel St Unit 83
- 1500 N Angel St Unit 17
- 2600 N Hill Rd Unit 19
- 1615 N Angel St Unit F
- 1615 N Angel St Unit I
- 1615 N Angel St Unit E
- 1615 N Angel St
- 1615 N Angel St Unit H
- 1627 N Angel St
Your Personal Tour Guide
Ask me questions while you tour the home.