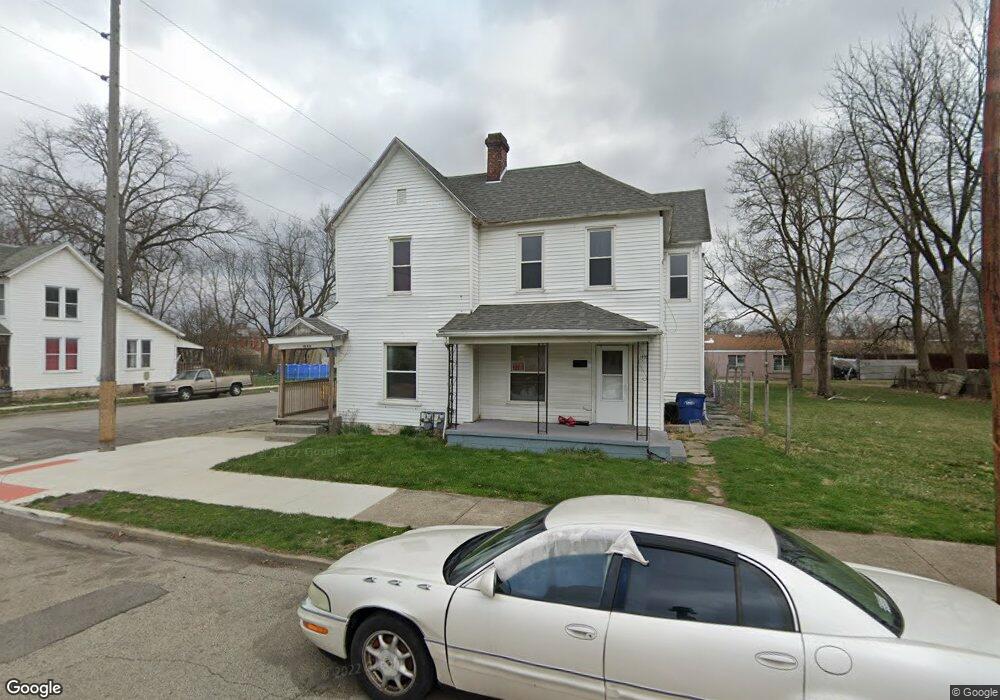
1032 W High St Unit 1036 Springfield, OH 45506
Estimated Value: $54,000 - $114,203
4
Beds
2
Baths
2,720
Sq Ft
$34/Sq Ft
Est. Value
About This Home
This home is located at 1032 W High St Unit 1036, Springfield, OH 45506 and is currently estimated at $92,551, approximately $34 per square foot. 1032 W High St Unit 1036 is a home located in Clark County with nearby schools including Snyder Park Elementary School, Roosevelt Middle School, and Springfield High School.
Ownership History
Date
Name
Owned For
Owner Type
Purchase Details
Closed on
Oct 6, 2023
Sold by
Mccall Mccune Homes Llc
Bought by
Kashkish Inc
Current Estimated Value
Purchase Details
Closed on
Mar 8, 2019
Sold by
Mccune Corbin and Mccall Eric
Bought by
Mccall Mccune Homes Llc
Purchase Details
Closed on
Aug 29, 2017
Sold by
Dixon Wade E
Bought by
Mccune Corbin and Mccall Eric N
Purchase Details
Closed on
Feb 13, 2012
Sold by
Bivens Don E and Bivens Judith K
Bought by
Dixon Wade E
Purchase Details
Closed on
Oct 19, 2004
Sold by
Bivens Don E and Bivens Judith K
Bought by
Ackley Kenneth A
Home Financials for this Owner
Home Financials are based on the most recent Mortgage that was taken out on this home.
Original Mortgage
$45,000
Interest Rate
5%
Mortgage Type
Seller Take Back
Purchase Details
Closed on
Apr 3, 1987
Create a Home Valuation Report for This Property
The Home Valuation Report is an in-depth analysis detailing your home's value as well as a comparison with similar homes in the area
Home Values in the Area
Average Home Value in this Area
Purchase History
| Date | Buyer | Sale Price | Title Company |
|---|---|---|---|
| Kashkish Inc | $50,000 | Aspen Land Title | |
| Kashkish Inc | $50,000 | Aspen Land Title | |
| Mccall Mccune Homes Llc | -- | None Available | |
| Mccune Corbin | $20,000 | None Available | |
| Dixon Wade E | $50,000 | Attorney | |
| Dixon Wade E | -- | Attorney | |
| Ackley Kenneth A | $50,000 | -- | |
| -- | $15,000 | -- |
Source: Public Records
Mortgage History
| Date | Status | Borrower | Loan Amount |
|---|---|---|---|
| Previous Owner | Ackley Kenneth A | $45,000 |
Source: Public Records
Tax History Compared to Growth
Tax History
| Year | Tax Paid | Tax Assessment Tax Assessment Total Assessment is a certain percentage of the fair market value that is determined by local assessors to be the total taxable value of land and additions on the property. | Land | Improvement |
|---|---|---|---|---|
| 2024 | $1,150 | $23,280 | $2,140 | $21,140 |
| 2023 | $1,331 | $23,280 | $2,140 | $21,140 |
| 2022 | $707 | $23,280 | $2,140 | $21,140 |
| 2021 | $1,045 | $19,010 | $1,880 | $17,130 |
| 2020 | $1,047 | $19,010 | $1,880 | $17,130 |
| 2019 | $1,050 | $19,010 | $1,880 | $17,130 |
| 2018 | $975 | $16,950 | $1,880 | $15,070 |
| 2017 | $974 | $16,951 | $1,880 | $15,071 |
| 2016 | $976 | $16,951 | $1,880 | $15,071 |
| 2015 | $995 | $16,951 | $1,880 | $15,071 |
| 2014 | $990 | $16,951 | $1,880 | $15,071 |
| 2013 | $980 | $16,951 | $1,880 | $15,071 |
Source: Public Records
Map
Nearby Homes
- 1009 W High St
- 1205 W High St
- 101`103 N Western
- 1120 W High St
- 833 W Mulberry St
- 1420 Parker Ct
- 681 W Jefferson St Unit 683
- 366 N Isabella St
- 423 N Jackson St Unit 425
- 40 Zischler St
- 222 N Race St Unit 224
- 22 Seever St
- 522 W North St Unit 524
- 1715 W North St
- 0 S Plum St
- 830 Dibert Ave
- 317 S Plum St
- 516 W Clark St
- 1201 Dibert Ave
- 0 Montgomery Ave
- 1028 W High St Unit 1030
- 1026 W High St
- 1102 W High St Unit 1104
- 1106 W High St Unit 1108
- 1018 W High St
- 16 S Bell Ave
- 1110 W High St Unit 1112
- 1014 W High St
- 1027 W High St
- 1010 W High St
- 1105 W High St
- 1105 W High St Unit 1105 A
- 5 S Western Ave
- 21 S Western Ave
- 1002 W High St
- 21 S Western Ave
- 1122 W High St
- 1117 W High St
- 1126 W High St
- 1121 W High St