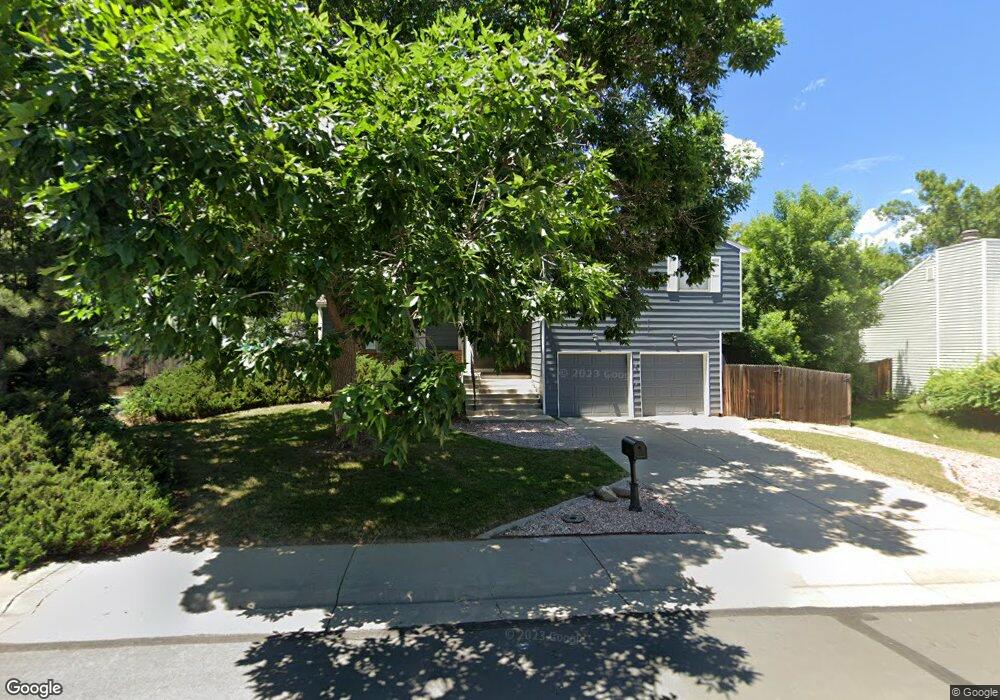
10321 Newcombe Ct Westminster, CO 80021
Walnut Grove NeighborhoodEstimated Value: $585,000 - $615,000
4
Beds
3
Baths
1,968
Sq Ft
$306/Sq Ft
Est. Value
About This Home
This home is located at 10321 Newcombe Ct, Westminster, CO 80021 and is currently estimated at $601,865, approximately $305 per square foot. 10321 Newcombe Ct is a home located in Jefferson County with nearby schools including Lukas Elementary School, Wayne Carle Middle School, and Standley Lake High School.
Ownership History
Date
Name
Owned For
Owner Type
Purchase Details
Closed on
Sep 1, 2021
Sold by
Zila Stanley L and Zila Stephanie S
Bought by
Byram Ellen J
Current Estimated Value
Home Financials for this Owner
Home Financials are based on the most recent Mortgage that was taken out on this home.
Original Mortgage
$422,000
Outstanding Balance
$383,415
Interest Rate
2.7%
Mortgage Type
New Conventional
Estimated Equity
$218,450
Purchase Details
Closed on
Aug 28, 1996
Sold by
Scott Richard A and Scott Robin E
Bought by
Zila Stanley L and Zila Stephanie S
Home Financials for this Owner
Home Financials are based on the most recent Mortgage that was taken out on this home.
Original Mortgage
$140,542
Interest Rate
8.24%
Mortgage Type
FHA
Purchase Details
Closed on
Feb 13, 1996
Sold by
Terry Michael L and Terry Robin Lee
Bought by
Scott Richard A and Scott Robin E
Home Financials for this Owner
Home Financials are based on the most recent Mortgage that was taken out on this home.
Original Mortgage
$139,980
Interest Rate
7.04%
Mortgage Type
FHA
Create a Home Valuation Report for This Property
The Home Valuation Report is an in-depth analysis detailing your home's value as well as a comparison with similar homes in the area
Home Values in the Area
Average Home Value in this Area
Purchase History
| Date | Buyer | Sale Price | Title Company |
|---|---|---|---|
| Byram Ellen J | $527,500 | Land Title Guarantee Company | |
| Zila Stanley L | $143,000 | Title America | |
| Scott Richard A | $142,500 | Land Title |
Source: Public Records
Mortgage History
| Date | Status | Borrower | Loan Amount |
|---|---|---|---|
| Open | Byram Ellen J | $422,000 | |
| Previous Owner | Zila Stanley L | $140,542 | |
| Previous Owner | Scott Richard A | $139,980 |
Source: Public Records
Tax History Compared to Growth
Tax History
| Year | Tax Paid | Tax Assessment Tax Assessment Total Assessment is a certain percentage of the fair market value that is determined by local assessors to be the total taxable value of land and additions on the property. | Land | Improvement |
|---|---|---|---|---|
| 2024 | $2,694 | $35,369 | $14,799 | $20,570 |
| 2023 | $2,694 | $35,369 | $14,799 | $20,570 |
| 2022 | $2,305 | $29,646 | $8,783 | $20,863 |
| 2021 | $2,339 | $30,498 | $9,035 | $21,463 |
| 2020 | $2,147 | $28,151 | $8,401 | $19,750 |
| 2019 | $2,113 | $28,151 | $8,401 | $19,750 |
| 2018 | $1,924 | $24,788 | $6,409 | $18,379 |
| 2017 | $1,723 | $24,788 | $6,409 | $18,379 |
| 2016 | $1,590 | $21,222 | $6,233 | $14,989 |
| 2015 | $1,373 | $21,222 | $6,233 | $14,989 |
| 2014 | $1,373 | $17,090 | $5,572 | $11,518 |
Source: Public Records
Map
Nearby Homes
- 10307 Owens St
- 11437 W 103rd Ave
- 10947 W 100th Dr
- 10411 Routt Ln
- 10571 Parfet Ct
- 10021 Miller St
- 11476 W 105th Dr
- 11496 W 106th Way
- 10665 Newcombe St
- 10610 Moore Ct
- 10541 Routt St
- 11221 W 107th Ave
- 11321 W 107th Ave
- 10687 W 107th Ave
- 10741 Owens St
- 11461 W 107th Place
- 14269 Currant St
- 14265 Currant St
- 14261 Currant St
- 14241 Currant St
- 10311 Newcombe Ct
- 10331 Newcombe Ct
- 10320 Oak St
- 10310 Oak St
- 10330 Oak St
- 10300 Oak St
- 10291 Newcombe Ct
- 10320 Newcombe Ct
- 10310 Newcombe Ct
- 10341 Newcombe Ct
- 10330 Newcombe Ct
- 10340 Oak St
- 10290 Oak St
- 10281 Newcombe Ct
- 10740 W 103rd Ave
- 10351 Newcombe Ct
- 10350 Oak St
- 10340 Newcombe Ct
- 10321 Newcombe St
- 10311 Newcombe St