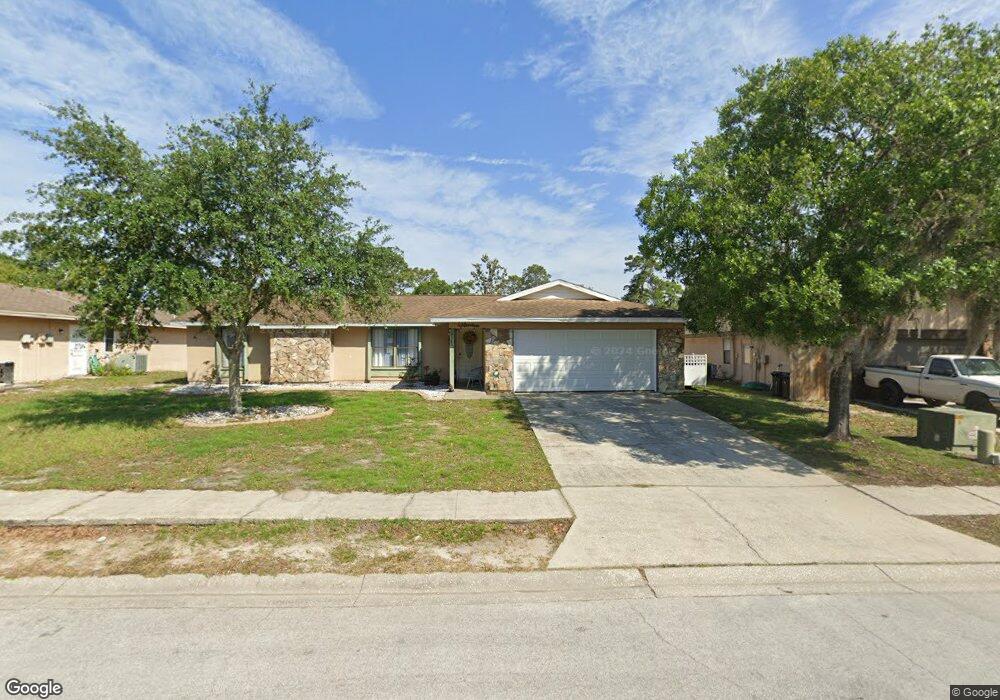
10323 Maverick St Unit 1 New Port Richey, FL 34654
River Ridge NeighborhoodEstimated Value: $268,000 - $366,000
3
Beds
2
Baths
2,148
Sq Ft
$151/Sq Ft
Est. Value
About This Home
This home is located at 10323 Maverick St Unit 1, New Port Richey, FL 34654 and is currently estimated at $323,851, approximately $150 per square foot. 10323 Maverick St Unit 1 is a home located in Pasco County with nearby schools including River Ridge High School, Cypress Elementary School, and River Ridge Middle School.
Ownership History
Date
Name
Owned For
Owner Type
Purchase Details
Closed on
Jan 11, 2011
Sold by
Schalmo John
Bought by
Markal Tufan
Current Estimated Value
Home Financials for this Owner
Home Financials are based on the most recent Mortgage that was taken out on this home.
Original Mortgage
$82,845
Outstanding Balance
$55,938
Interest Rate
4.58%
Mortgage Type
FHA
Estimated Equity
$267,913
Purchase Details
Closed on
Feb 23, 2010
Sold by
Us Bank Na
Bought by
Schalmo John
Purchase Details
Closed on
Mar 25, 2008
Sold by
Thompson Jeffrey E
Bought by
Us Bank Na and Gpmft 2007-Ar1
Purchase Details
Closed on
May 9, 2003
Sold by
Warren Dorothy Gail and Shaw Dorothy Gail
Bought by
Thompson Jeffrey E
Home Financials for this Owner
Home Financials are based on the most recent Mortgage that was taken out on this home.
Original Mortgage
$101,650
Interest Rate
5.81%
Mortgage Type
Purchase Money Mortgage
Create a Home Valuation Report for This Property
The Home Valuation Report is an in-depth analysis detailing your home's value as well as a comparison with similar homes in the area
Home Values in the Area
Average Home Value in this Area
Purchase History
| Date | Buyer | Sale Price | Title Company |
|---|---|---|---|
| Markal Tufan | $85,000 | Equity National Title Llc | |
| Schalmo John | $49,900 | Buyers Title Inc | |
| Us Bank Na | -- | None Available | |
| Thompson Jeffrey E | $107,000 | -- | |
| Thompson Jeffrey E | $107,000 | Galaxy Title Agency Llc |
Source: Public Records
Mortgage History
| Date | Status | Borrower | Loan Amount |
|---|---|---|---|
| Open | Markal Tufan | $82,845 | |
| Previous Owner | Thompson Jeffrey E | $101,650 |
Source: Public Records
Tax History Compared to Growth
Tax History
| Year | Tax Paid | Tax Assessment Tax Assessment Total Assessment is a certain percentage of the fair market value that is determined by local assessors to be the total taxable value of land and additions on the property. | Land | Improvement |
|---|---|---|---|---|
| 2025 | $1,434 | $116,640 | -- | -- |
| 2024 | $1,434 | $113,360 | -- | -- |
| 2023 | $1,370 | $110,060 | $44,506 | $65,554 |
| 2022 | $1,218 | $106,860 | $0 | $0 |
| 2021 | $1,183 | $103,750 | $33,264 | $70,486 |
| 2020 | $1,157 | $102,320 | $24,640 | $77,680 |
| 2019 | $1,126 | $100,020 | $0 | $0 |
| 2018 | $1,073 | $96,729 | $0 | $0 |
| 2017 | $1,063 | $96,729 | $0 | $0 |
| 2016 | $1,005 | $92,790 | $0 | $0 |
| 2015 | $1,018 | $92,145 | $0 | $0 |
| 2014 | $984 | $95,659 | $14,553 | $81,106 |
Source: Public Records
Map
Nearby Homes
- 7507 Katherine Dr
- 10235 Maverick St
- 10319 Widgeon Way
- 10305 Copperwood Dr
- 7320 Auburn Ln
- 7530 Roy Ct
- 7536 Roland Ct
- 10319 Alberta Ct
- 7051 Woodibis Dr
- 10636 Millriver Dr
- 7222 Auburn Ln
- 10301 Bellwood Ave
- 7636 Haig Ct
- 10718 Fiddlesticks Ct
- 7633 Piping Rock Ct
- 0 Red Oak Loop
- 10908 Claymont Dr
- 10900 Livingston Dr
- 6606 Garden Palm Ct
- 7814 Brisbane Ct
- 10317 Maverick St
- 10329 Maverick St
- 10310 Turkey Oak Dr
- 10316 Turkey Oak Dr
- 10304 Turkey Oak Dr
- 10311 Maverick St
- 10335 Maverick St
- 10318 Maverick St
- 10324 Maverick St
- 10322 Turkey Oak Dr
- 10300 Turkey Oak Dr
- 10312 Maverick St
- 10330 Maverick St
- 10341 Maverick St
- 10301 Maverick St
- 10328 Turkey Oak Dr
- 10336 Maverick St
- 10305 Turkey Oak Dr
- 10236 Turkey Oak Dr
- 10306 Maverick St