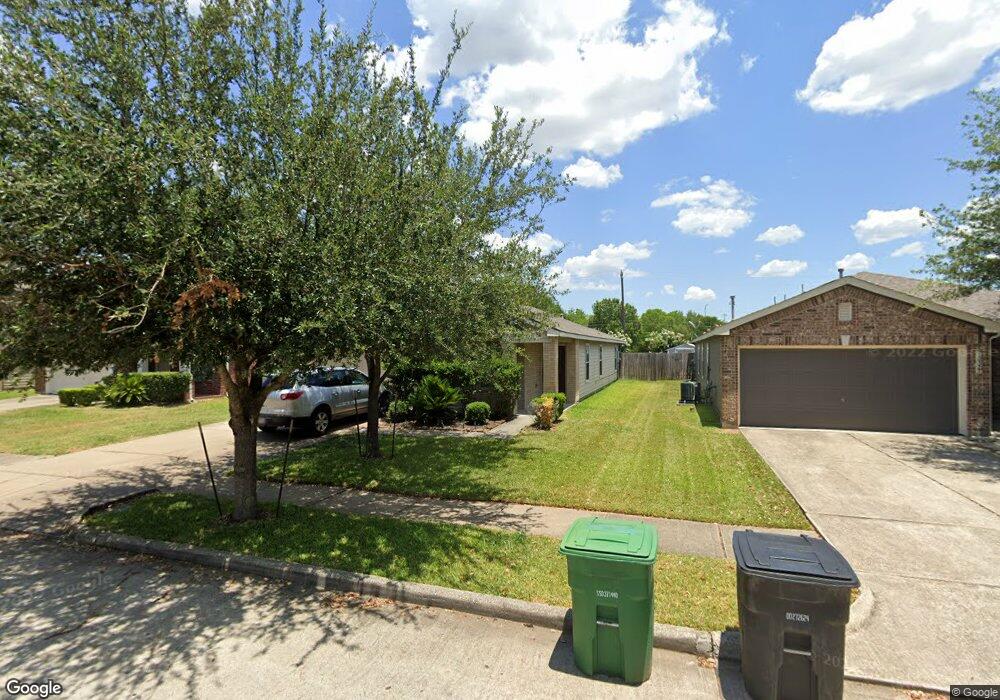
10323 Southover Ct Houston, TX 77075
Southbelt-Ellington NeighborhoodEstimated Value: $263,000 - $278,000
3
Beds
2
Baths
1,989
Sq Ft
$135/Sq Ft
Est. Value
About This Home
This home is located at 10323 Southover Ct, Houston, TX 77075 and is currently estimated at $269,199, approximately $135 per square foot. 10323 Southover Ct is a home located in Harris County with nearby schools including Laura Welch Bush Elementary School, Morris Middle School, and Beverly Hill Intermediate School.
Ownership History
Date
Name
Owned For
Owner Type
Purchase Details
Closed on
Jun 17, 2008
Sold by
Centex Homes
Bought by
Johnson Willie B and Fisher Latashia M
Current Estimated Value
Home Financials for this Owner
Home Financials are based on the most recent Mortgage that was taken out on this home.
Original Mortgage
$132,315
Outstanding Balance
$85,036
Interest Rate
6.08%
Mortgage Type
FHA
Estimated Equity
$184,163
Create a Home Valuation Report for This Property
The Home Valuation Report is an in-depth analysis detailing your home's value as well as a comparison with similar homes in the area
Home Values in the Area
Average Home Value in this Area
Purchase History
| Date | Buyer | Sale Price | Title Company |
|---|---|---|---|
| Johnson Willie B | -- | None Available |
Source: Public Records
Mortgage History
| Date | Status | Borrower | Loan Amount |
|---|---|---|---|
| Open | Johnson Willie B | $132,315 |
Source: Public Records
Tax History Compared to Growth
Tax History
| Year | Tax Paid | Tax Assessment Tax Assessment Total Assessment is a certain percentage of the fair market value that is determined by local assessors to be the total taxable value of land and additions on the property. | Land | Improvement |
|---|---|---|---|---|
| 2025 | $5,371 | $248,408 | $41,481 | $206,927 |
| 2024 | $5,371 | $259,445 | $41,481 | $217,964 |
| 2023 | $5,371 | $259,445 | $41,481 | $217,964 |
| 2022 | $6,572 | $240,907 | $41,481 | $199,426 |
| 2021 | $6,286 | $199,144 | $36,601 | $162,543 |
| 2020 | $6,188 | $189,176 | $36,601 | $152,575 |
| 2019 | $6,084 | $180,408 | $36,601 | $143,807 |
| 2018 | $1,857 | $161,130 | $30,901 | $130,229 |
| 2017 | $5,195 | $155,832 | $30,901 | $124,931 |
| 2016 | $4,999 | $151,236 | $28,326 | $122,910 |
| 2015 | $3,610 | $140,892 | $25,751 | $115,141 |
| 2014 | $3,610 | $130,906 | $25,751 | $105,155 |
Source: Public Records
Map
Nearby Homes
- 9319 Canady Park Ln
- 10406 Sutter Glen Ln
- 10518 Tenleyton Ln
- 10223 Belcamp Ct
- 7329 Madison Commons Ln
- 7322 Madison Commons Ln
- 0 Fuqua St Unit 64883593
- 0 Fuqua St Unit 45902141
- 0 Fuqua St Unit 97219329
- 10506 Pleasant Villas Ln
- 10610 Stover St
- 9238 Quercus Cir
- 10410 Stover St
- 9602 Sumerlin St
- 10307 Collin Park
- 9610 Sumerlin St
- 9307 Fuqua Ridge Ln
- 10098 Serrano Park Dr
- 9616 Habitat St
- 9618 Habitat St
- 10319 Southover Ct
- 10327 Southover Ct
- 10315 Southover Ct
- 10311 Southover Ct
- 9334 Wolcott Park Ln
- 10322 Southover Ct
- 10318 Southover Ct
- 9338 Wolcott Park Ln
- 10310 Southover Ct
- 9342 Wolcott Park Ln
- 10307 Southover Ct
- 10314 Southover Ct
- 9346 Wolcott Park Ln
- 9330 Wolcott Park Ln
- 9326 Wolcott Park Ln
- 9322 Wolcott Park Ln
- 10323 Dalehurst Ct
- 9339 Delmont Park Ln
- 10327 Dalehurst Ct
- 10319 Dalehurst Ct