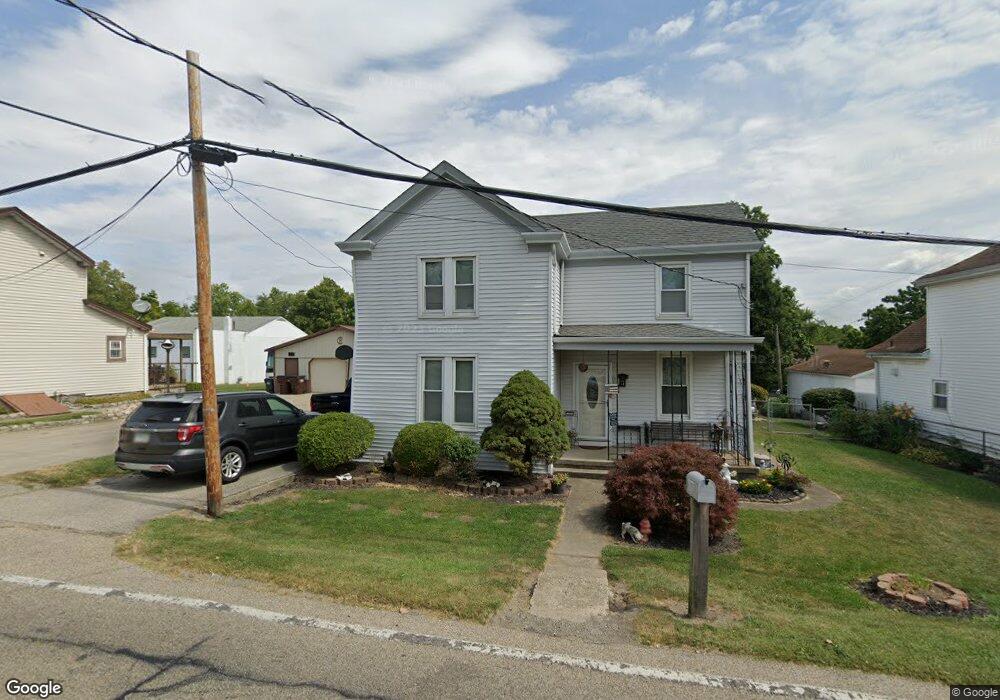
10324 Burlington Rd Cincinnati, OH 45231
New Burlington NeighborhoodEstimated Value: $182,000 - $238,000
3
Beds
1
Bath
1,608
Sq Ft
$133/Sq Ft
Est. Value
About This Home
This home is located at 10324 Burlington Rd, Cincinnati, OH 45231 and is currently estimated at $213,746, approximately $132 per square foot. 10324 Burlington Rd is a home located in Hamilton County with nearby schools including Mt Healthy High School, Hamilton County Mathematics and Science Academy, and Central Montessori Academy.
Ownership History
Date
Name
Owned For
Owner Type
Purchase Details
Closed on
Apr 28, 2003
Sold by
Jacobs John E and Jacobs Donna L
Bought by
Jewell Lori A
Current Estimated Value
Home Financials for this Owner
Home Financials are based on the most recent Mortgage that was taken out on this home.
Original Mortgage
$76,302
Interest Rate
6.44%
Mortgage Type
FHA
Purchase Details
Closed on
Mar 25, 2003
Sold by
Ficke Anne M and Ficke Neil
Bought by
Jacobs John E and Jacobs Donna L
Home Financials for this Owner
Home Financials are based on the most recent Mortgage that was taken out on this home.
Original Mortgage
$76,302
Interest Rate
6.44%
Mortgage Type
FHA
Purchase Details
Closed on
Jul 14, 2000
Sold by
Estate Of John E Jacobs
Bought by
Ficke Anne M and Jacobs John E
Create a Home Valuation Report for This Property
The Home Valuation Report is an in-depth analysis detailing your home's value as well as a comparison with similar homes in the area
Home Values in the Area
Average Home Value in this Area
Purchase History
| Date | Buyer | Sale Price | Title Company |
|---|---|---|---|
| Jewell Lori A | $77,500 | -- | |
| Jacobs John E | $18,200 | -- | |
| Ficke Anne M | -- | -- |
Source: Public Records
Mortgage History
| Date | Status | Borrower | Loan Amount |
|---|---|---|---|
| Previous Owner | Jewell Lori A | $76,302 |
Source: Public Records
Tax History Compared to Growth
Tax History
| Year | Tax Paid | Tax Assessment Tax Assessment Total Assessment is a certain percentage of the fair market value that is determined by local assessors to be the total taxable value of land and additions on the property. | Land | Improvement |
|---|---|---|---|---|
| 2024 | $3,210 | $55,035 | $9,167 | $45,868 |
| 2023 | $3,039 | $55,035 | $9,167 | $45,868 |
| 2022 | $2,479 | $32,253 | $8,925 | $23,328 |
| 2021 | $2,426 | $32,253 | $8,925 | $23,328 |
| 2020 | $2,446 | $32,253 | $8,925 | $23,328 |
| 2019 | $2,070 | $21,056 | $7,028 | $14,028 |
| 2018 | $1,718 | $21,056 | $7,028 | $14,028 |
| 2017 | $1,635 | $21,056 | $7,028 | $14,028 |
| 2016 | $1,714 | $21,827 | $6,689 | $15,138 |
| 2015 | $1,725 | $21,827 | $6,689 | $15,138 |
| 2014 | $1,716 | $21,827 | $6,689 | $15,138 |
| 2013 | $1,845 | $23,986 | $7,350 | $16,636 |
Source: Public Records
Map
Nearby Homes
- 1917 Springdale Rd
- 10410 Maria Ave
- 1763 Springdale Rd
- 2000 Struble Rd
- 10443 Burlington Rd
- 1662 Springdale Rd
- 10467 Mill Rd
- 10591 Wellingwood Ct
- 10493 Mill Rd
- 10525 Mill Rd
- 1762 Lockbourne Dr
- 10242 Chippenham Ct
- 10359 Hawkhurst Dr
- 10216 Hawkhurst Dr
- 1717 Aspenhill Dr
- 1805 Miles Rd
- 1629 Miles Rd
- 1890 Lotushill Dr
- 2599 Ambassador Dr
- 9933 Grasscreek Ct
- 10318 Burlington Rd
- 10330 Burlington Rd
- 1920 Springdale Rd
- 1935 Springdale Rd
- 10348 Burlington Rd
- 10348 Burlington Rd
- 1905 Springdale Rd
- 10354 Burlington Rd
- 1904 Springdale Rd
- 10349 Burlington Rd
- 1897 Springdale Rd
- 10360 Burlington Rd
- 10353 Burlington Rd
- 1880 Springdale Rd
- 10326 Faske Dr
- 10268 Burlington Rd
- 1977 Struble Rd
- 10372 Burlington Rd
- 10336 Faske Dr
- 1872 Springdale Rd