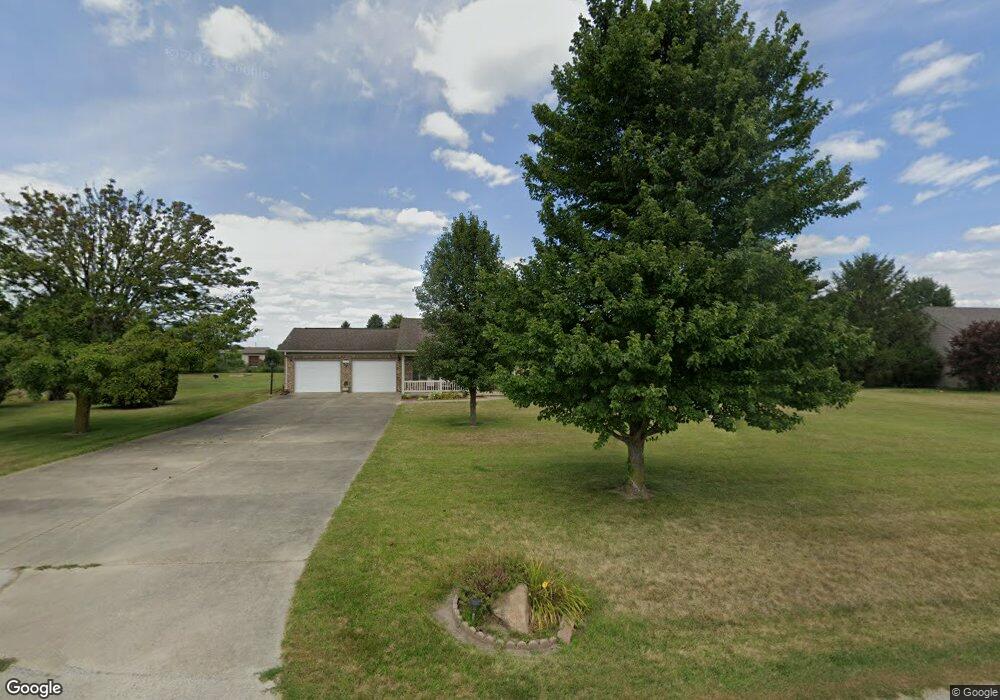
10325 W 400 N Delphi, IN 46923
Estimated Value: $304,000 - $351,974
3
Beds
2
Baths
1,782
Sq Ft
$182/Sq Ft
Est. Value
About This Home
This home is located at 10325 W 400 N, Delphi, IN 46923 and is currently estimated at $324,494, approximately $182 per square foot. 10325 W 400 N is a home located in Carroll County with nearby schools including Delphi Community Elementary School, Delphi Community Middle School, and Delphi Community High School.
Ownership History
Date
Name
Owned For
Owner Type
Purchase Details
Closed on
Dec 6, 2024
Sold by
Houser Caroline
Bought by
Houser Caroline and Houser Rhonda S
Current Estimated Value
Purchase Details
Closed on
Dec 13, 2018
Sold by
Houser Caroline
Bought by
Houser Rhonda S
Purchase Details
Closed on
Nov 26, 2018
Sold by
Houser Richard
Bought by
Houser Caroline
Purchase Details
Closed on
Nov 19, 1997
Sold by
Mears Richard and Mears Magdalene
Bought by
Houser Richard and Houser Caroline
Create a Home Valuation Report for This Property
The Home Valuation Report is an in-depth analysis detailing your home's value as well as a comparison with similar homes in the area
Home Values in the Area
Average Home Value in this Area
Purchase History
| Date | Buyer | Sale Price | Title Company |
|---|---|---|---|
| Houser Caroline | -- | None Listed On Document | |
| Houser Caroline | -- | None Listed On Document | |
| Houser Rhonda S | -- | None Available | |
| Houser Caroline | -- | None Available | |
| Houser Richard | $11,500 | -- |
Source: Public Records
Tax History Compared to Growth
Tax History
| Year | Tax Paid | Tax Assessment Tax Assessment Total Assessment is a certain percentage of the fair market value that is determined by local assessors to be the total taxable value of land and additions on the property. | Land | Improvement |
|---|---|---|---|---|
| 2024 | $1,792 | $289,700 | $37,300 | $252,400 |
| 2023 | $1,642 | $212,400 | $37,300 | $175,100 |
| 2022 | $1,105 | $189,800 | $37,300 | $152,500 |
| 2021 | $1,023 | $172,400 | $37,300 | $135,100 |
| 2020 | $1,060 | $167,400 | $33,300 | $134,100 |
| 2019 | $943 | $149,900 | $33,300 | $116,600 |
| 2018 | $874 | $148,300 | $33,300 | $115,000 |
| 2017 | $837 | $149,900 | $33,300 | $116,600 |
| 2016 | $927 | $156,600 | $28,000 | $128,600 |
| 2014 | $743 | $130,400 | $23,200 | $107,200 |
Source: Public Records
Map
Nearby Homes
- 9331 W 310 N
- 2801 N 930 W Unit 10
- 4139 N 900 W
- 11503 W Tecumseh Bend Rd
- 1158 N Brewer Ave
- 2075 N 925 W
- 317 N Market St
- 610 N Wilson St
- 409 N Wilson St
- 205 E Franklin St
- 215 W Front St
- 215 N High St
- 6369 N 1225 West Crossroad
- 10360 S Wildwood Ct
- 116 Williston Ct
- 232 W Vine St
- 230 W Vine St
- 228 W Vine St
- 112 Williston Ct
- 35 Pond View Dr