10328 N 2430 Rd Weatherford, OK 73096
Estimated Value: $388,000 - $514,000
4
Beds
4
Baths
2,683
Sq Ft
$167/Sq Ft
Est. Value
About This Home
This home is located at 10328 N 2430 Rd, Weatherford, OK 73096 and is currently estimated at $446,899, approximately $166 per square foot. 10328 N 2430 Rd is a home located in Custer County with nearby schools including Burcham Elementary School, Weatherford West Elementary School, and Lt. General Thomas P. Stafford Elementary School.
Ownership History
Date
Name
Owned For
Owner Type
Purchase Details
Closed on
Jan 3, 2013
Sold by
Pearce William H
Bought by
Settles Eldon Stacy
Current Estimated Value
Purchase Details
Closed on
Dec 30, 2009
Sold by
Tompkins Brian W and Tompkins Stepha
Bought by
Pearce William H
Purchase Details
Closed on
Jul 14, 2006
Sold by
Halliburton Real Est Serv
Bought by
Brian W Tompkins
Purchase Details
Closed on
Jul 10, 2006
Sold by
Buddy Petersen
Bought by
Halliburton Real Est Serv
Purchase Details
Closed on
May 16, 2005
Sold by
Curtiss L Mc Donald
Bought by
Buddy Petersen
Purchase Details
Closed on
Jul 30, 2004
Sold by
Stephen A Villines
Bought by
Curtiss and Sheri Mc Donald
Purchase Details
Closed on
Sep 22, 1999
Sold by
Christopher T Gray
Bought by
Stephen A Villines
Purchase Details
Closed on
Jan 2, 1998
Sold by
Todd Gray
Bought by
Todd Gray
Purchase Details
Closed on
Jun 30, 1997
Sold by
Jimmie Mc Phearson
Bought by
Todd Gray
Create a Home Valuation Report for This Property
The Home Valuation Report is an in-depth analysis detailing your home's value as well as a comparison with similar homes in the area
Home Values in the Area
Average Home Value in this Area
Purchase History
| Date | Buyer | Sale Price | Title Company |
|---|---|---|---|
| Settles Eldon Stacy | $331,000 | -- | |
| Pearce William H | $295,000 | -- | |
| Brian W Tompkins | $280,000 | -- | |
| Halliburton Real Est Serv | $280,000 | -- | |
| Buddy Petersen | $269,000 | -- | |
| Curtiss | $253,000 | -- | |
| Stephen A Villines | $188,000 | -- | |
| Todd Gray | -- | -- | |
| Todd Gray | $15,000 | -- |
Source: Public Records
Tax History Compared to Growth
Tax History
| Year | Tax Paid | Tax Assessment Tax Assessment Total Assessment is a certain percentage of the fair market value that is determined by local assessors to be the total taxable value of land and additions on the property. | Land | Improvement |
|---|---|---|---|---|
| 2025 | $3,823 | $40,510 | $5,382 | $35,128 |
| 2024 | $3,823 | $39,764 | $4,124 | $35,640 |
| 2023 | $3,823 | $38,606 | $1,796 | $36,810 |
| 2022 | $3,618 | $38,606 | $1,796 | $36,810 |
| 2021 | $3,647 | $38,606 | $1,796 | $36,810 |
| 2020 | $3,686 | $37,575 | $1,796 | $35,779 |
| 2019 | $3,776 | $38,092 | $1,796 | $36,296 |
| 2018 | $3,330 | $36,983 | $1,796 | $35,187 |
| 2017 | $3,418 | $37,273 | $1,796 | $35,477 |
| 2016 | $3,369 | $36,411 | $1,796 | $34,615 |
| 2015 | $3,418 | $36,411 | $1,796 | $34,615 |
| 2014 | $3,506 | $36,411 | $1,796 | $34,615 |
Source: Public Records
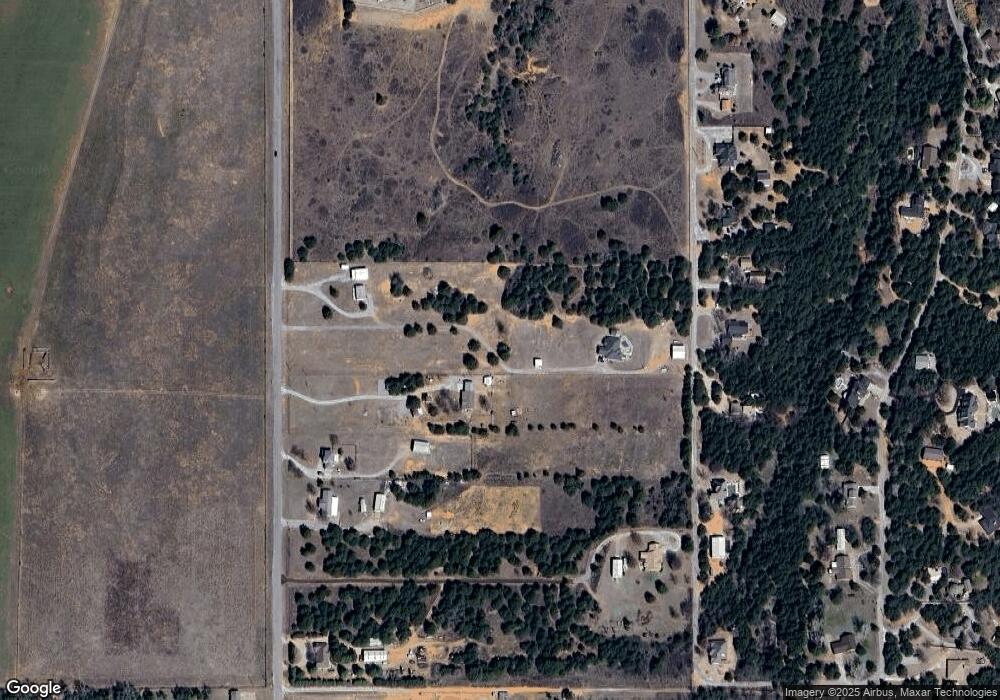
Map
Nearby Homes
- 10336 N County Road 2432 Rd
- 10389 N 2432 Cir
- 10288 N 2431 Rd
- 10281 N 2422 Cir
- 24239 E 1040 County Rd
- 3505 Nicklaus Dr
- 3500 Nicklaus Dr
- 13 S Waylon Cir
- 0 E Eagle Rd
- 10 S Waylon Way
- 11 S Waylon Cir
- 12 S Waylon Cir
- 9 S Waylon Cir
- 0 N 2440 Rd Unit South 1168840
- 0 N 2440 Rd Unit North 1168833
- 1415 Lewis Rd
- 704 Highland Dr
- 14 E Waylon Cir
- 2110 Valley View Rd
- 8 S Waylon Cir
- 10328 N 2432 Cir
- 10332 N 2432 Cir
- 10326 N 2432 Cir
- 10326 N 2432 Cir Unit 1
- 10322 N 2432 Cir
- 10336 N 2432 Cir
- 10362 N 2432 Cir
- 10356 N 2432 Cir
- 10312 N 2432 Cir
- 10352 N 2432 Cir
- 10342 N 2432 Cir
- 10374 N 2432 Cir
- 00000 N 2432 Cir
- 0000 N 2432 Cir
- 10363 N 2432 Cir
- 10378 N 2432 Cir
- 10378 N 2432 Cir
- 24318 E 1035 Rd
- 10306 N 2432 Cir
- 10371 N 2432 Cir