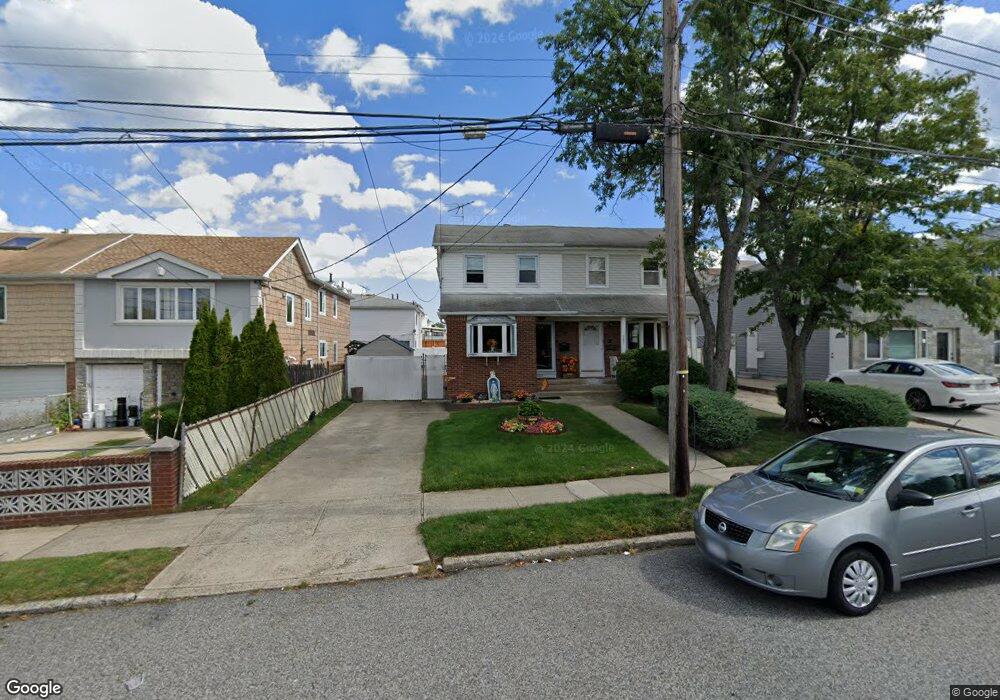
1033 Armstrong Ave Staten Island, NY 10308
Great Kills NeighborhoodEstimated Value: $672,068 - $731,000
3
Beds
2
Baths
1,280
Sq Ft
$551/Sq Ft
Est. Value
About This Home
This home is located at 1033 Armstrong Ave, Staten Island, NY 10308 and is currently estimated at $705,517, approximately $551 per square foot. 1033 Armstrong Ave is a home located in Richmond County with nearby schools including P.S. 32 The Gifford School, I.S. 075 Frank D. Paulo, and Susan E Wagner High School.
Ownership History
Date
Name
Owned For
Owner Type
Purchase Details
Closed on
Jun 25, 2015
Sold by
Goyco Nellie and Goyco Jelson K
Bought by
Goyco Nellie
Current Estimated Value
Purchase Details
Closed on
Jan 18, 2007
Sold by
Goyco Jelson
Bought by
Goyco Nellie and Goyco Jelson K
Home Financials for this Owner
Home Financials are based on the most recent Mortgage that was taken out on this home.
Original Mortgage
$148,556
Outstanding Balance
$118,665
Interest Rate
6.16%
Mortgage Type
Unknown
Estimated Equity
$586,852
Purchase Details
Closed on
Jul 24, 2001
Sold by
Tortorella Gary and Tortorella Linda
Bought by
Goyco Jelson and Goyco Nellie
Home Financials for this Owner
Home Financials are based on the most recent Mortgage that was taken out on this home.
Original Mortgage
$235,000
Interest Rate
6.89%
Mortgage Type
Unknown
Purchase Details
Closed on
Sep 19, 1997
Sold by
Tortorella Gary
Bought by
Tortorella Gary and Tortorella Linda
Create a Home Valuation Report for This Property
The Home Valuation Report is an in-depth analysis detailing your home's value as well as a comparison with similar homes in the area
Home Values in the Area
Average Home Value in this Area
Purchase History
| Date | Buyer | Sale Price | Title Company |
|---|---|---|---|
| Goyco Nellie | -- | None Available | |
| Goyco Nellie | $107,000 | Ticor Title Insurance Co | |
| Goyco Jelson | $255,000 | -- | |
| Tortorella Gary | -- | -- |
Source: Public Records
Mortgage History
| Date | Status | Borrower | Loan Amount |
|---|---|---|---|
| Open | Goyco Nellie | $148,556 | |
| Previous Owner | Goyco Jelson | $235,000 |
Source: Public Records
Tax History Compared to Growth
Tax History
| Year | Tax Paid | Tax Assessment Tax Assessment Total Assessment is a certain percentage of the fair market value that is determined by local assessors to be the total taxable value of land and additions on the property. | Land | Improvement |
|---|---|---|---|---|
| 2025 | $6,164 | $38,280 | $8,636 | $29,644 |
| 2024 | $6,176 | $34,740 | $8,978 | $25,762 |
| 2023 | $6,057 | $31,225 | $8,198 | $23,027 |
| 2022 | $5,594 | $33,060 | $9,720 | $23,340 |
| 2021 | $5,897 | $31,200 | $9,720 | $21,480 |
| 2020 | $5,703 | $29,220 | $9,720 | $19,500 |
| 2019 | $5,301 | $28,740 | $9,720 | $19,020 |
| 2018 | $5,007 | $26,021 | $8,431 | $17,590 |
| 2017 | $4,705 | $24,549 | $9,537 | $15,012 |
| 2016 | $4,598 | $24,549 | $9,446 | $15,103 |
| 2015 | $3,972 | $23,618 | $7,758 | $15,860 |
| 2014 | $3,972 | $22,284 | $7,064 | $15,220 |
Source: Public Records
Map
Nearby Homes
- 74 E Brandis Ave
- 350 Brookfield Ave
- 379 Brookfield Ave
- 467 Ridgewood Ave
- 443 Ridgewood Ave
- 466 Doane Ave
- 88 Cortelyou Ave
- 339 Abingdon Ave
- 919 Armstrong Ave
- 924 Armstrong Ave Unit 2-3
- 131 Cortelyou Ave Unit 1-1
- 307 Abingdon Ave
- 259 Brookfield Ave
- 543 Eltingville Blvd
- 414 Elverton Ave
- 345 Colon Ave
- 72 Eric Ln
- 12 Lexington Ln
- 87 Pemberton Ave
- 248 Abingdon Ave
- 1031 Armstrong Ave
- 1037 Armstrong Ave
- 1039 Armstrong Ave
- 1025 Armstrong Ave
- 386 Gurley Ave
- 384 Gurley Ave
- 39 E Brandis Ave
- 1021 Armstrong Ave
- 380 Gurley Ave
- 37 E Brandis Ave
- 378 Gurley Ave
- 35 E Brandis Ave
- 33 E Brandis Ave
- 376 Gurley Ave
- 393 Gurley Ave
- 395 Gurley Ave
- 29 E Brandis Ave
- 374 Gurley Ave
- 387 Gurley Ave
- 1011 Armstrong Ave