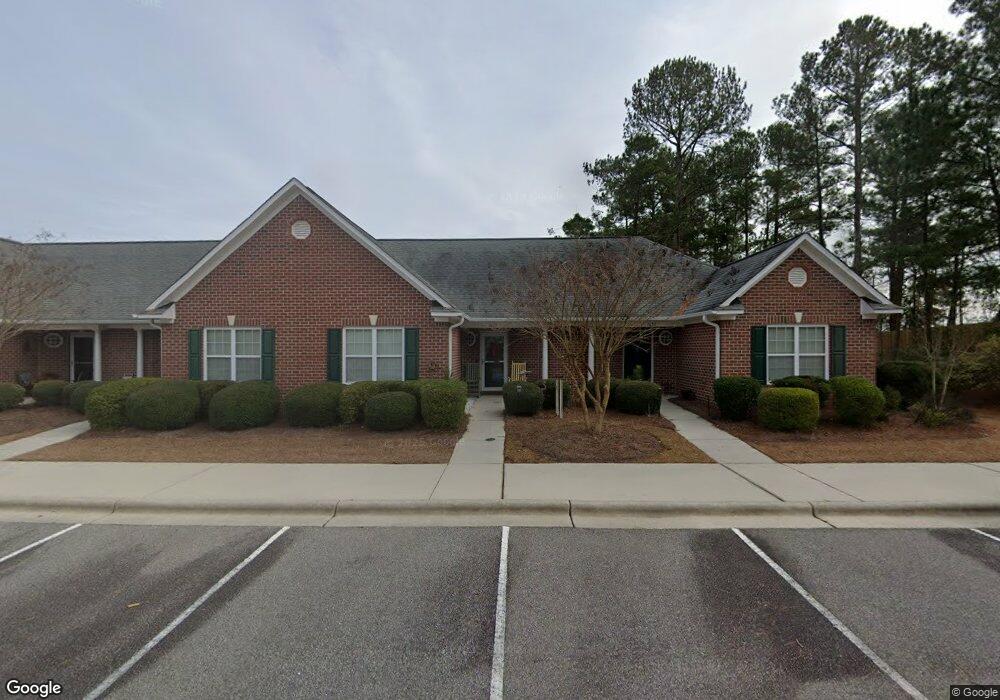
1033 Bridgeport Way Unit 32R Leland, NC 28451
Estimated Value: $225,547 - $230,000
2
Beds
2
Baths
1,093
Sq Ft
$208/Sq Ft
Est. Value
About This Home
This home is located at 1033 Bridgeport Way Unit 32R, Leland, NC 28451 and is currently estimated at $227,137, approximately $207 per square foot. 1033 Bridgeport Way Unit 32R is a home located in Brunswick County with nearby schools including Lincoln Elementary School, Leland Middle School, and North Brunswick High School.
Ownership History
Date
Name
Owned For
Owner Type
Purchase Details
Closed on
Nov 4, 2020
Sold by
Long Emily Grace
Bought by
Wright Kenneth Harold and Wright Holly Alexandra
Current Estimated Value
Home Financials for this Owner
Home Financials are based on the most recent Mortgage that was taken out on this home.
Original Mortgage
$109,900
Outstanding Balance
$97,971
Interest Rate
2.9%
Mortgage Type
New Conventional
Estimated Equity
$129,166
Purchase Details
Closed on
Oct 31, 2011
Sold by
Pyramid Homes Inc
Bought by
Long Emily Grace
Home Financials for this Owner
Home Financials are based on the most recent Mortgage that was taken out on this home.
Original Mortgage
$113,016
Interest Rate
4.16%
Mortgage Type
New Conventional
Purchase Details
Closed on
Sep 11, 2007
Sold by
Southwood Developers Inc
Bought by
Pyramid Homes Inc
Create a Home Valuation Report for This Property
The Home Valuation Report is an in-depth analysis detailing your home's value as well as a comparison with similar homes in the area
Home Values in the Area
Average Home Value in this Area
Purchase History
| Date | Buyer | Sale Price | Title Company |
|---|---|---|---|
| Wright Kenneth Harold | $160,000 | None Available | |
| Long Emily Grace | $109,000 | None Available | |
| Pyramid Homes Inc | -- | None Available |
Source: Public Records
Mortgage History
| Date | Status | Borrower | Loan Amount |
|---|---|---|---|
| Open | Wright Kenneth Harold | $109,900 | |
| Previous Owner | Long Emily Grace | $113,016 |
Source: Public Records
Tax History Compared to Growth
Tax History
| Year | Tax Paid | Tax Assessment Tax Assessment Total Assessment is a certain percentage of the fair market value that is determined by local assessors to be the total taxable value of land and additions on the property. | Land | Improvement |
|---|---|---|---|---|
| 2025 | $1,401 | $196,230 | $25,000 | $171,230 |
| 2024 | $1,401 | $196,230 | $25,000 | $171,230 |
| 2023 | $1,016 | $196,230 | $25,000 | $171,230 |
| 2022 | $1,016 | $115,720 | $20,000 | $95,720 |
| 2021 | $1,016 | $115,720 | $20,000 | $95,720 |
| 2020 | $969 | $115,720 | $20,000 | $95,720 |
| 2019 | $954 | $20,240 | $20,000 | $240 |
| 2018 | $831 | $20,360 | $20,000 | $360 |
| 2017 | $831 | $20,360 | $20,000 | $360 |
| 2016 | $779 | $20,360 | $20,000 | $360 |
| 2015 | $747 | $101,630 | $20,000 | $81,630 |
| 2014 | $817 | $120,680 | $35,000 | $85,680 |
Source: Public Records
Map
Nearby Homes
- 1004 Bridgeport Way
- 1048 Bridgeport Way
- 1074 Bridgeport Way
- 1086 Bridgeport Way
- 1091 Bridgeport Way
- 1130 Amber Pines Dr
- 1151 Amber Pines Dr
- 1018 Ashland Way
- 2210 Palm Pointe
- 2173 Palm Pointe
- 1706 Pepperwood Way
- 1128 Crestfield Way
- 1216 Bella Vista Ln NE
- 1227 Bella Vista Ln NE
- 1419 Parkland Way
- 1259 Bella Vista Ln NE
- 1437 Spring Pine Ct NE
- 3801 River Park Way NE
- 2314 Hickory Bottom Ct NE
- 1522 Pine Harbor Way
- 1033 Bridgeport Way
- 1031 Bridgeport Way
- 1035 Bridgeport Way
- 1029 Bridgeport Way
- 1027 Bridgeport Way
- 1025 Bridgeport Way
- 1021 Bridgeport Way
- 1019 Bridgeport Way
- 1023 Bridgeport Way
- 1017 Bridgeport Way
- 1015 Bridgeport Way
- 1013 Bridgeport Way
- 1045 Bridgeport Way
- 1043 Bridgeport Way
- 1047 Bridgeport Way
- 1041 Bridgeport Way
- 1039 Bridgeport Way
- 1039 Bridgeport Way Unit 29R
- 1037 Bridgeport Way
- 0 Bridgeport Way