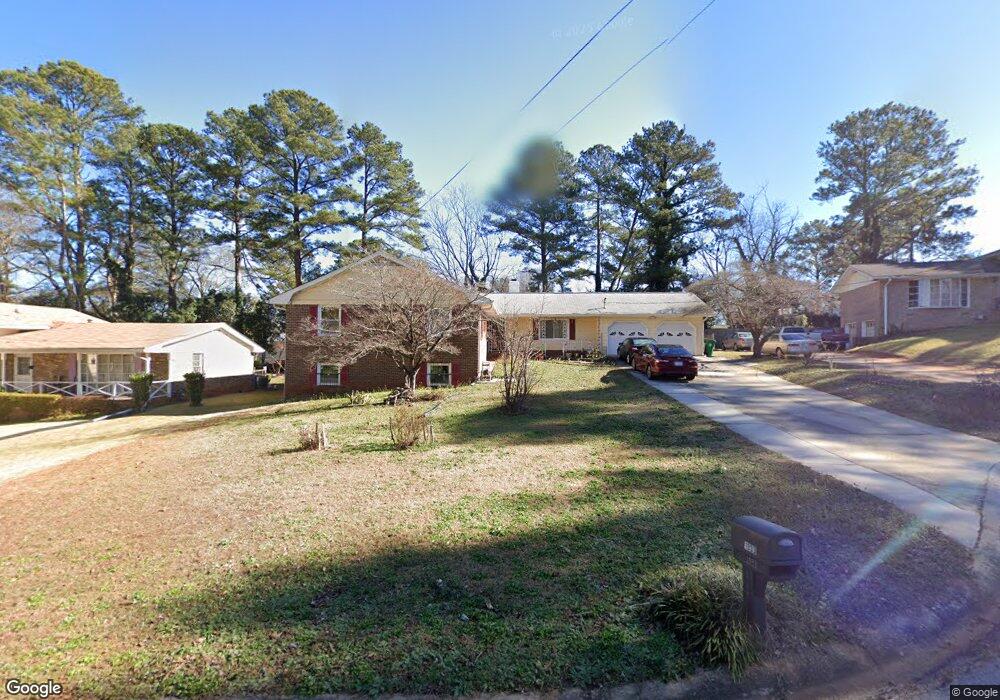
1033 Celtic Cir Stone Mountain, GA 30083
Estimated Value: $301,000 - $346,409
3
Beds
2
Baths
1,873
Sq Ft
$168/Sq Ft
Est. Value
About This Home
This home is located at 1033 Celtic Cir, Stone Mountain, GA 30083 and is currently estimated at $314,602, approximately $167 per square foot. 1033 Celtic Cir is a home located in DeKalb County with nearby schools including Jolly Elementary School, Freedom Middle School, and Clarkston High School.
Ownership History
Date
Name
Owned For
Owner Type
Purchase Details
Closed on
Aug 27, 2024
Sold by
My Phuong Thi Do Revocable Trust
Bought by
My Phuong Thi Do Revocable Trust and Do My Phuong Thi Trust
Current Estimated Value
Purchase Details
Closed on
Jan 9, 2024
Sold by
Le Hung Manh
Bought by
Do My Phuong Thi
Purchase Details
Closed on
May 26, 2014
Sold by
Ha Diem Chau Thi
Bought by
Thi Le Hung Manh and Thi My Phuong
Purchase Details
Closed on
Jun 18, 2007
Sold by
Le Hai C
Bought by
Le Hai C and Ha Diem C
Home Financials for this Owner
Home Financials are based on the most recent Mortgage that was taken out on this home.
Original Mortgage
$130,000
Interest Rate
5.81%
Mortgage Type
New Conventional
Create a Home Valuation Report for This Property
The Home Valuation Report is an in-depth analysis detailing your home's value as well as a comparison with similar homes in the area
Home Values in the Area
Average Home Value in this Area
Purchase History
| Date | Buyer | Sale Price | Title Company |
|---|---|---|---|
| My Phuong Thi Do Revocable Trust | -- | -- | |
| My Phuong Thi Do Revocable Trust | -- | -- | |
| Do My Phuong Thi | $300,000 | -- | |
| Thi Le Hung Manh | -- | -- | |
| Le Hai C | -- | -- | |
| Le Hai C | $162,500 | -- |
Source: Public Records
Mortgage History
| Date | Status | Borrower | Loan Amount |
|---|---|---|---|
| Previous Owner | Le Hai C | $130,000 |
Source: Public Records
Tax History
| Year | Tax Paid | Tax Assessment Tax Assessment Total Assessment is a certain percentage of the fair market value that is determined by local assessors to be the total taxable value of land and additions on the property. | Land | Improvement |
|---|---|---|---|---|
| 2025 | $4,641 | $143,840 | $32,000 | $111,840 |
| 2024 | $3,795 | $137,600 | $32,000 | $105,600 |
| 2023 | $3,795 | $132,920 | $32,000 | $100,920 |
Source: Public Records
Map
Nearby Homes
- 1050 Rays Rd
- 4191 Central Dr
- 933 Viking Dr
- 4274 Cavan Dr
- 1149 Alpine Hills Dr
- 4549 Erskine Rd
- 904 Abingdon Ct
- 876 Belle Glade Dr
- 3878 Nielsen Ct
- 4424 Central Dr
- 4245 Parkview Ct Unit H
- 4263 Parkview Ct
- 4252 Parkview Ct
- 1523 Sagewood Cir
- 3804 Cottage Cir
- 911 E Green Ln
- 6765 Baynes Hill Dr
- 3846 Cottage Cir
- 3852 Cottage Cir
- 4482 Hunters Terrace
- 1041 Celtic Cir
- 1027 Celtic Cir
- 1028 Rays Rd
- 1020 Rays Rd
- 1023 Celtic Cir Unit II
- 1023 Celtic Cir
- 1036 Rays Rd
- 1047 Celtic Cir
- 1012 Rays Rd
- 1014 Celtic Cir
- 1044 Rays Rd
- 1015 Celtic Cir Unit 2
- 1042 Celtic Cir
- 1053 Celtic Cir
- 4196 Norman Rd
- 4188 Norman Rd
- 1050 Celtic Cir Unit 2
- 4206 Norman Rd
- 4180 Norman Rd Unit 16
- 4180 Norman Rd
Your Personal Tour Guide
Ask me questions while you tour the home.